Facebook
 X
X
 Pinterest
 Copy Link
How’s the Market? Q3 2026 Review of Seattle Area Real Estate

Summer is seasonally slumpy in the Greater Seattle area. There are so many distractions! Looking back at our Summer Slump this year, however, we believe it could be a sign of things to come. With new listings up year over year, sales cooling, and more than 3 months worth of listing inventory (4+ months on the Eastside), we may be nearing the first true buyer’s market we’ve seen since September of 2011.
Prices dipped or remained flat in most areas, although a few neighborhoods saw a year-over-year boost. About half of Seattle homes and 1/3 of Eastside homes sold within their first 10 days on the market. While exceptionally desirable properties still drew bidding wars, the vast majority of homes sold at or below their listed prices.
The stats are sobering, but our situation is so much different now than in 2011. The main difference: homeowners have equity to tap into in most cases. Nationally, over 41% of homeowners have more than 50% equity in their homes. In 2011 we were plagued by short sales and foreclosures, which is simply not the case today. While interest rates have hit their highest levels since 2000, it is still a great time to move, especially if you’re considering a trade up. Remember, inventory hasn’t been this plentiful in 15 (fifteen!) years. If you’re feeling like you’ve outgrown your house or your house has outgrown you, a skilled agent can help you with an analysis to decide if it’s your time to take advantage of this buyer’s market.
Click or scroll down to find your area report:
Seattle | Eastside | Mercer Island | Condos | Waterfront
SEATTLE
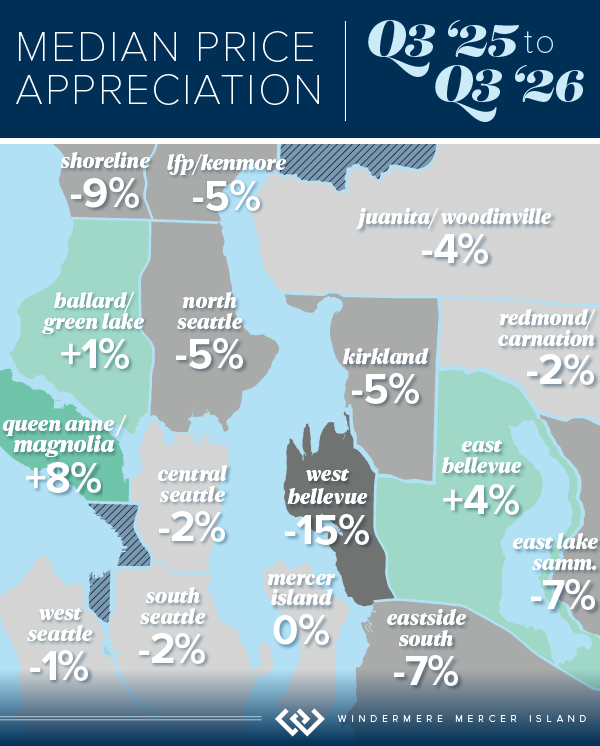
The core Seattle neighborhoods seem to still be attracting attention (and gains); Queen Anne/Magnolia saw a 9% dip in volume but an 8% gain in median price, from $1,299,000 to $1,399,000. Shoreline saw a 9% dip in price while sales volume stayed steady at -2%.
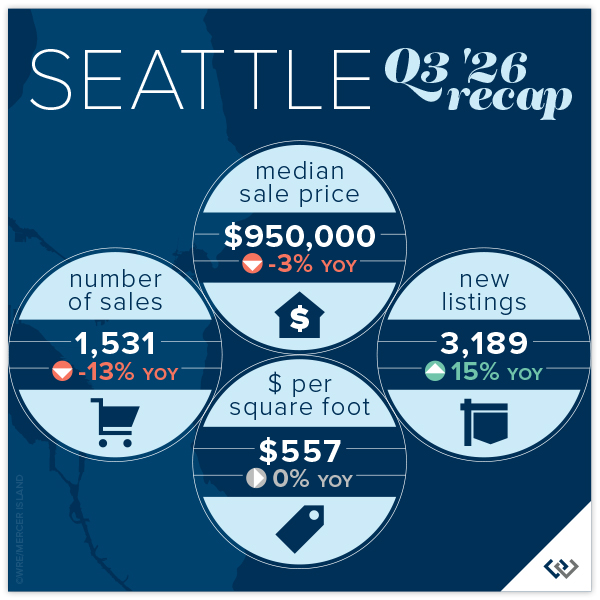
All in all, residential real estate in the city remained relatively flat, seeing a 3% drop from Q3 2025. It will be interesting to see what the quarters to come will hold. In true Seattle fashion, the booms aren’t as big and the dips are easier to fare.
Click here for the full report and neighborhood-by-neighborhood statistics!

EASTSIDE
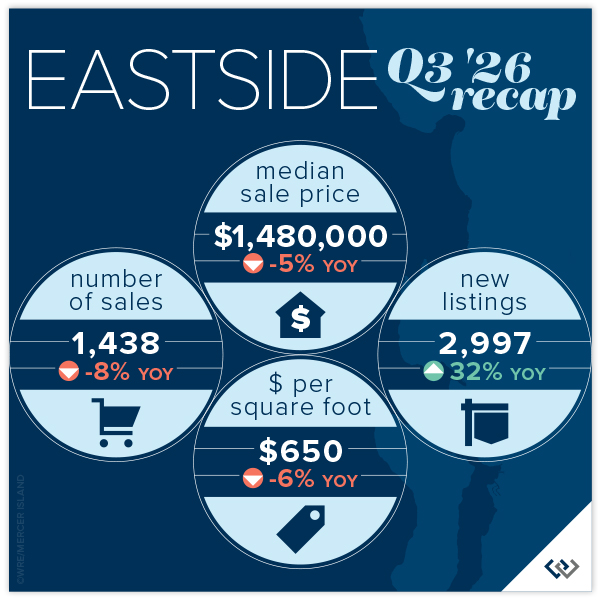
It is clear that the ultra-high end has had the largest correction; West Bellevue is down 15% year over year and 22% since the peak in Q4 2025. Mercer Island is flat year over year, but the disparity between median active price ($3.3m) and median sold price ($2.4m) tells us that there is a glut of high-end inventory.
The bright spot for sellers is East Bellevue, posting a 4% year-over-year gain at a median price of $1,610,000. With all of this, 36% of homes still sold above the list price, a sure sign that some home sellers are taking their savvy agents’ advice on positioning.
Click here for the full report and neighborhood-by-neighborhood statistics!

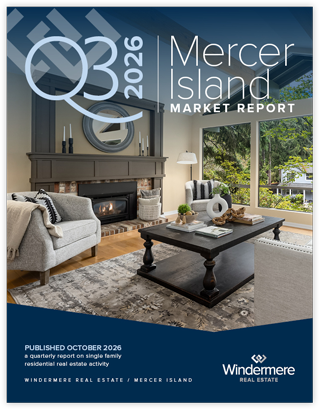
MERCER ISLAND
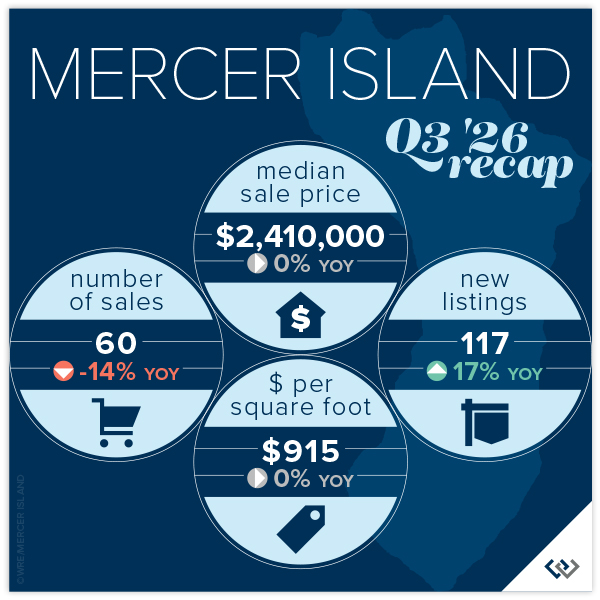
If you can “nail” price and presentation, you have a 55% chance of selling in the first 10 days on the market and being like the 43% of homes that sold for at or above list price during Q3. If you’re on First Hill, in Mercer Island Estates or the Lakes, odds are you’re in this group; 100% of those homes sold in the first 10 days. Location, Location, Location! Though, if you don’t get it right the first time (like 57% of the market) you could be facing a pool of buyers who expect a larger discount than we’ve seen in recent years.
New listings are up year over year on the Island by 17%, making this a good time to trade up if you’ve been considering an upgrade. There are 18 active waterfront properties and with only 3 sales in Q3 (typically waterfront season) that translates to 18 months of waterfront inventory. I can’t remember a better time to snag a piece of coastline!
Click here for the full report and neighborhood-by-neighborhood statistics!
CONDOS – SEATTLE & EASTSIDE
Year-over-year Seattle condo prices slipped 2.7%, which is the slimmest margin we’ve seen in a while. There is a large disparity across the region with Lake Forest Park seeing a 27% gain in median price compared to an 18% decline for Downtown condos. The velocity doesn’t seem to be affected with 22% of listings selling in the first 10 days and an average of 39% of all homes selling above asking price. Our home shoppers are savvy and willing to jump for something special.
On the Eastside there is slightly more volatility. Sales are down a total of 26%, meaning only 409 lucky home sellers were able to hand over their keys in Q3. When you consider that there were 1,109 new listings, that number is tough to swallow. Those home shoppers got great deals as the median price was down 12% year-over-year. Nowhere was this more true than on Mercer Island with a 23% dip in median price (though with only 14 of those 409 sales, that dip may just be a temporary product shift).
The stats are sobering, but somewhat encouraging, especially if you are thinking about stepping onto the first rung of the property ladder. Condos are an incredible value and prices have to be hitting the bottom. While some homeowners have equity, we’re often seeing prices go back to 2017 and 2018 levels. There are 25 condos in King County listed as short sales. The bargains are out there just waiting to be snapped up!
Check out area-by-area details in the full condo report.

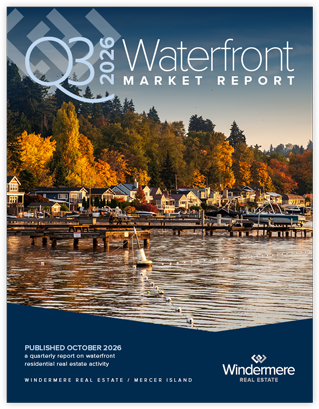
WATERFRONT
Seattle and Lake Sammamish led the pack in Q3 with 12 waterfront home sales each. Both beat last year’s numbers, with Seattle up from 10 and Lake Sammamish up from 9 in Q3 2025. On the other hand, the Eastside slowed to 7 sales from 11 a year ago. Mercer Island also saw a slowdown with just 3 waterfront sales compared to 6 in Q3 of last year.
In spite of its lower volume of sales, Mercer Island can still boast the highest price: $28 million for a custom estate clocking in at nearly 10,000 sq. ft. with over an acre of grounds and 109 feet of prime low-bank waterfront. At the opposite end, a 1929 fixer on the south end of Lake Sammamish sold off-market at a steal (and below its assessed value) for just $1,000,000.
This brief overview of the entire Seattle-Eastside private waterfront market, including Mercer Island and Lake Sammamish, illustrates the trends occurring in our region over time. This data is interesting and insightful but cannot replace an in-depth waterfront analysis with your trusted professional.
View the full waterfront report

Find a Home | Sell Your Home | Property Research
Neighborhoods | Market Reports | Our Team
We earn the trust and loyalty of our brokers and clients by doing real estate exceptionally well. The leader in our market, we deliver client-focused service in an authentic, collaborative, and transparent manner and with the unmatched knowledge and expertise that comes from decades of experience.
2737 77th Ave SE, Mercer Island, WA 98040 | (206) 232-0446
mercerisland@windermere.com
© Copyright 2026, Windermere Real Estate/Mercer Island. Information and statistics derived from Northwest Multiple Listing Service and Trendgraphix, and deemed accurate but not guaranteed.
Seattle report cover photo courtesy of Anni Zilz; and Andrew Webb, Clarity NW Photography.
Eastside report cover photo courtesy of Mike Ferreri; and Kell Morrissey, Clarity NW Photography.
Mercer Island report cover photo courtesy of Laurie Givan; and Matthew Gallant, Clarity NW Photography.
Condo report cover photo courtesy of Luke Bartlett; and Matthew Gallant, Clarity NW Photography.
Our Favorite Local Pumpkin Patches – 2026

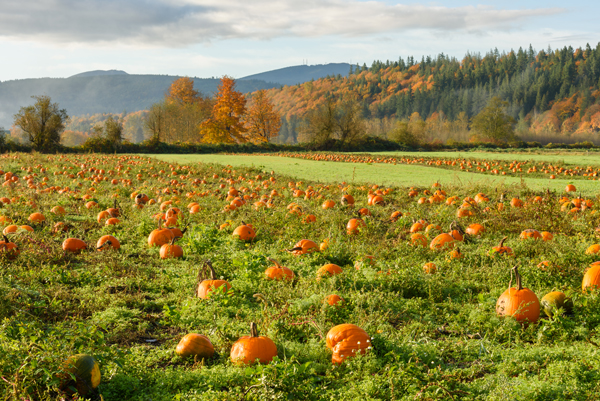
Grab your flannel…fall is coming in for a landing, and pumpkin patches around the Sound are getting ready to throw open their gates! From peaceful roadside farms to full-blown autumn playgrounds with corn mazes, zip lines, and activities galore, here are our favorite local haunts where you can soak up the season. Most run every weekend through October (a few start this weekend!), and several are happy to have your leashed pup tag along. Bonus: after dark, some of the farms and corn mazes become haunted…or overrun by zombies with paintball guns. Scroll down for the lowdown on each patch!
Eastside | North of Seattle | South of Seattle
Eastside
Fletcher Farm
Leashed dogs encouraged! Scavenger hunt, farm animal zoo, storybook trail, mini-golf, photo stations, and junior corn maze for the little ones.
Open Sat & Sun, 11a-6p | 9/26-10/31
18712 SE May Valley Road | Issaquah
fletcherfarmevents@gmail.com
fletcherfarmissaquah.com
JB Pumpkin Farm & Puzzle Patch
Snap beautiful photos in the Sunflower Walk, get lost in the giant corn maze, or choose from a colorful variety of pumpkins & gourds. Bring your pet!
Open Thurs, 2-7p & Fri-Sun, 9a-7p | 9/19-10-31
14063 NE 145th Street | Woodinville
(425) 380-1515
jbfamilygrowers.com
Jubilee Farm
Weekend hay rides, food trucks, animals, barn store, & hot apple cider.
Sat & Sun, 10a-5p | Every weekend in October
(Basic u-pick also open M-F, 10am-5pm)
229 W Snoqualmie River Rd NE | Carnation
jubileefarm@hotmail.com
jubileefarm.org
McMurtrey Farm
Wagon rides, a corn field hunt, photo boards, duck races, games, kettle corn, face painting, and more. Leashed pets welcome!
Open Wed-Sun, 10a-6p | 9/23-10/31
13925 Redmond-Woodinville Rd. NE | Redmond
(425) 482-6795
mcmurtreyfarm.com/pumpkin-patch
Novelty Hill Farm
Dog-friendly! Corn maze, farm critters, trike track, hay mow, & picnic/fire pit rentals.
Open Fridays, 3-6p & Sat/Sun, 10a-5p | 10/2-10/31
(Self-serve pumpkin patch & corn maze also open daily)
26617 NE 124th Street | Duvall
(425) 788-2416
noveltyhillfarm.com
Oxbow Farm & Conservation Center
Apple trebuchet competition, food, hay house, clue hunt, hay rides, mini pumpkin painting, living playground, & more.
10/17, 10/18, 10/24, & 10/25 | 10a-4p
10819 Carnation-Duvall Rd. NE | Carnation
(425) 788-1134
oxbow.org/oxtober
Remlinger Farms
25 rides & attractions for children (including a train, carousel, & mini roller-coaster!), pony rides, arcade, corn maze, apple cannon, cafe, & brewery with 20 choices on tap.
Open Fri, Sat & Sun, 10a-6p | 9/26-11/1
(Quieter self-guided tours by reservation on Thursdays, Oct 1, 8, 15, 22 & 29, 10a-3p)
32610 NE 32nd Street | Carnation, WA
(425) 333-4135
remlingerfarms.com
Serres Farm
Mini train rides, corn maze and a dazzling variety of specialty pumpkins.
Open Sat & Sun, 9a-5p | Every weekend in October
20306 NE 50th St | Redmond, WA
(425) 868-3017
serresfarm.com
North of Seattle
Bob’s Corn & Pumpkin Farm
12-acre corn maze, 2 kids’ mazes, play barn, hay rides, trike track, & apple cannon. Fire pit rentals for private groups, too!
Open Daily, 10a-7p (Last entry @5p) | 9/19-11/1
Night Maze: Fridays & Saturdays, 5:30-11p (Last entry @9:30p)
10917 Elliott Road | Snohomish
(360) 668-2506
bobscorn.com/fall-activities
Carleton Farm
Corn maze, play area, jump pad, paintball shooting gallery, apple cannons, hay rides, & kids’ bucket train.
Full Activities on Saturdays, 10a-6p & Sun, 10a-5p | Weekends in October
630 Sunnyside Blvd SE | Lake Stevens, WA
(425) 343-4963
carletonfarm.com
Craven Farm
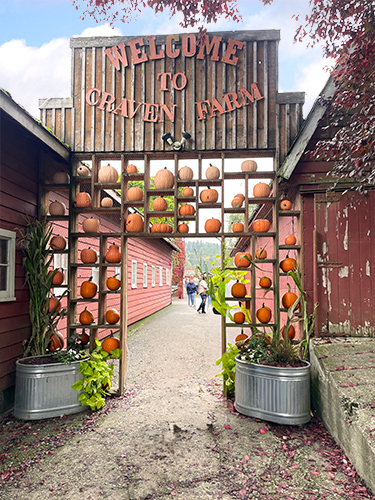
15-acre corn maze, kids maze, jump pad, farm animals, mini golf, cow train, foosball, apple cannon, espresso, cider donuts, & paintball gallery. Fire pit rentals, and special dog-friendly days, too! New this year: a Hay-ground play area.
Open Wed-Sun, 10a-6p | 9/19-11/1
13817 Short School Road | Snohomish
hello@cravenfarm.com
cravenfarm.com/fall-festival
Fairbank Animal & Pumpkin Farm
Lots of baby animals, corn “maize maze,” tiny tot hay tunnel, toy duck races, photo boards, & veggie garden.
Open 10a-5p | Every weekend in October
15308 52nd Ave W | Edmonds
(425) 743-3694
fairbankfarm.com
Stocker Farms
30+ attractions including a mega slide, giant jumping pillow, tire mountain, epic play area, zip line, corn maze, pumpkin cannon, & more. The farm’s evil twin, Stalker Farms, comes out at night.
Open Weekends 9/19-20 & 9/26-27, then Daily 10/1-10/31 | 10a-6p (Last entry @5p)
8705 Marsh Rd | Snohomish
(360) 568-7391
stockerfarms.com
Swans Trail Farms
Washington State corn maze, kids corn maze, petting farm, wagon rides, big slides, zip lines, u-pick apple orchard & live duck races.
Open Daily 10a-6p | 9/12-10/31
“Great Harvest Glow” on weekends from 5-9:30p (Fri-Sun in Sept, Thurs-Sun in Oct)
7301 Rivershore Rd | Snohomish
(425) 330-3084
swanstrailfarms.com
Thomas Family Farm
Turn pumpkin picking into an epic event with mini golf, inflatables, kids paintball, a fun park, apple cannon, gem mining, fire pit rentals, food galore, and the new “Super Mega Tube Slide”—in addition to 149 different varieties of pumpkins. Those looking to get spooked should check out their nighttime activities, too (hint: there are zombies).
Open Fri, 11a-6p & Sat-Sun, 10a-6p | Every Weekend in October
9010 Marsh Rd | Snohomish
(360) 568-6945
thomasfamilyfarm.com
South of Seattle
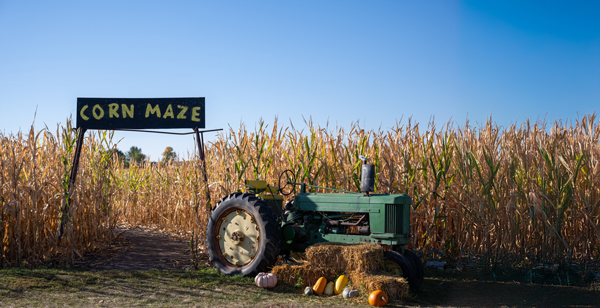
Carpinito Brothers Corn Maze & Pumpkin Patch
Rubber duck races, hay slides, corn pit, farm animals, hay maze, & corn maze. New this year: a Giant Pumpkin Weigh-Off on Sun, Oct 4.
Open Daily 9a-6p (or until dusk) | 9/25-10/31
Pumpkin Patch: 27508 W Valley Hwy N | Kent
Farm Fun Yard: 6720 S 277th St | Kent
(253) 854-5692
carpinito.com
Knutson Farms
Don’t miss the 7:30 fireworks shows on Oct. 10th, 17th, & 24th. Corn & hay mazes, petting zoo, cow train, sandboxes, apple cannon, jump pads, & pumpkin bowling, too.
Open Daily 10a-6p (8pm on Fireworks Nights) | 10/3-10/31
16406 78th St East | Sumner
(253) 863-5107
knutsonfarmsinc.com/the-patch
Maris Farms
Racing pigs & ducks, mega slide, corn maze, jump pillow, animals, zip lines, rides, plus the creepy “Haunted Woods” complete with zombies and homicidal maniacs. New this year: fire pit rentals and a daylight “no scares” walk through the Haunted Woods.
Fri & Sat, 10a-10p; Sun, 10a-7p | 9/26-10/31
Last admission is 2 hours before closing. Also open 1-7p on select weekdays. Check here for dates.
25001 Sumner-Buckley Highway | Buckley
(253) 264-5400
marisfarms.com
Mosby Farms
Dog-friendly! Corn maze and fresh farm market.
Open Daily 10a-5:30p | 10/1-10/30
3104 SE Auburn-Black Diamond Rd | Auburn
(253) 939-7666
mosbyfarm.com/pumpkinpatch
Spooner Farms
Corn maze, pumpkin sling shot, speedway, farm animals, caramel apples, & roasted corn.
Open Daily 9a-6p | 9/27-10/31
9710 State Route 162 East | Puyallup
(253) 840-2059
spoonerberries.com
Thomasson Family Farm
Corn maze, wagon rides, play barn, farm animals, duck races, slides, trike track, and games. On weekends there’s also laser tag, an apple slingshot, mega slide, and zip line.
Open Daily 9:30a-5:30p | 9/26-10/30
38223 236th Avenue SE | Enumclaw
contactus@thomassonfamilyfarm.com
thomassonfarm.com
Find a Home | Sell Your Home | Property Research
Neighborhoods | Market Reports | Our Team
We earn the trust and loyalty of our brokers and clients by doing real estate exceptionally well. The leader in our market, we deliver client-focused service in an authentic, collaborative, and transparent manner and with the unmatched knowledge and expertise that comes from decades of experience.
2737 77th Ave SE, Mercer Island, WA 98040 | (206) 232-0446
mercerisland@windermere.com
© Copyright 2026, Windermere Real Estate / Mercer Island.
2026 Seattle & Eastside Farmers Markets

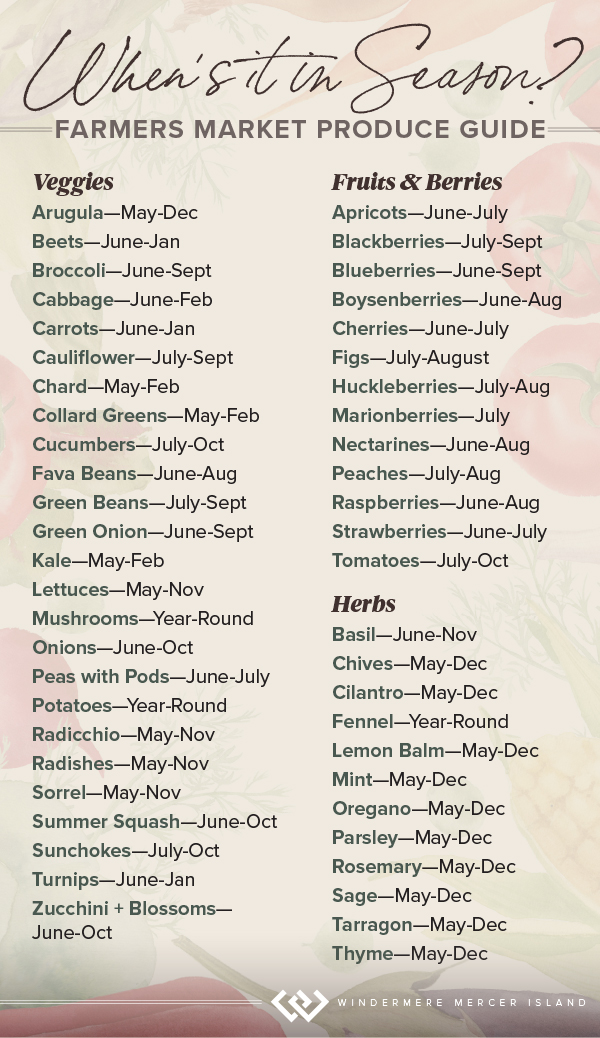
Wow, spring has sprung and 2026 is flying by…ready to renew your New Year’s resolution to eat better? Nothing makes it easier than a wide array of fresh, locally picked fruits and veggies. Add in some live music, amazing street food, and that feel-good knowledge that you’re supporting small businesses, and it’s a recipe for a great time. Here are all of the details so you can find a market near you or explore somewhere new…
Seattle Metro
- Ballard
- Capitol Hill (Broadway)
- Central District (Madrona)
- Columbia City
- Fremont
- Lake City
- Lake Forest Park
- Madison Park
- Magnolia
- Phinney
- Pike Place
- Queen Anne
- Shoreline
- South Lake Union – Thursday Market
- South Lake Union – Saturday Market
- U-District
- Wallingford
- West Seattle
Greater Eastside
- Bellevue – Crossroads
- Bellevue – Downtown
- Carnation
- Duvall
- Issaquah
- Kirkland – Downtown
- Kirkland – Juanita
- Mercer Island
- North Bend
- Redmond
- Renton
- Sammamish
- Woodinville
Seattle Metro
Ballard
Seattle’s first year-round Farmers Market, selling produce exclusively from Washington state farmers along the historic cobblestone stretch of Ballard Ave.
Sundays, 9am – 2pm | Year-Round
5345 Ballard Ave NW | Seattle
sfmamarkets.com/visit-ballard-farmers-market/
Capitol Hill (Broadway)
Come for Sunday brunch from food vendors who source ingredients from local, WA state farms (many of whom you’ll also meet selling their wares at the market). Live music and street performers often make an appearance, too.
Sundays, 11am – 3pm | Year-Round
Tuesdays, 3pm – 7pm (June 2 – September 29, 2026)
E Barbara Bailey Way | Seattle
seattlefarmersmarkets.org/chfm
Central District (Formerly Madrona)
Located in one of Seattle’s most diverse neighborhoods, you’ll find artisan foods as well as seasonal produce from Washington state farmers, fishers, and ranchers.
Fridays, 3pm – 7pm | May 15 – Oct 30, 2026
MLK Way & E Union St | Seattle
sfmamarkets.com/central-district-farmers-market
Columbia City
With everything from freshly harvested Asian greens to Ethiopian eats, come check out the immense variety King County’s most diverse zip code has to offer. Bring your bounty to adjacent Columbia Park for a picnic.
Wednesdays, 3pm – 7pm | May 6 – Oct 28, 2026
37th Ave S & S Edmunds St | Seattle
seattlefarmersmarkets.org/ccfm
Fremont
Seattle’s largest weekly street market is set along the Fremont Canal, and you can find just about everything at this “hyper market”—an eclectic mix of a farmer’s market, flea market and artists’ alley. The brunch food is pretty epic, too!
Sundays, 10am – 4pm
March 29-October: 3401 Evanston Ave N | Seattle
Nov-March: 701 N Northlake Way | Seattle
fremontmarket.com
Lake City
This celebrated North End seasonal market offers unique finds grown and prepared by local farms and food artisans. Enjoy kids’ activities, too!
Thursdays, 3pm – 7pm | June 4 – Sept 24, 2026
Saturdays, 10am – 2pm | Oct 3 – Dec 19, 2026
NE 125th St & 28th Ave NE | Seattle
seattlefarmersmarkets.org/lcfm
Lake Forest Park
With an emphasis on fresh, locally grown food, this market is an epicurean’s delight. Browse hard cider, baked goods, preserves, meat, pasta, sauces, and prepared foods along with the locally harvested fruits and veggies. There is also one “Crafts Market” each summer featuring local artisans.
Sundays, 10am – 2pm | May 10 – Oct 18, 2026
17171 Bothell Way NE | Lake Forest Park
www.thirdplacecommons.org/farmers-market
Madison Park
Stretching right alongside the park with its bathhouse and swimming beach, you’ll find ample produce from Washington State farms as well as delectable hot food vendors.
Saturdays, 10am – 2pm | May 16 – Oct 17, 2026
E Madison St & 42nd Ave E | Seattle
www.sfmamarkets.com/madison-park-farmers-market
Magnolia
This popular Saturday market is nestled in the tree-lined Magnolia Village. In addition to seasonal fruits and veggies, you’ll find sweet & savory pies, fresh bread, flowers, and more!
Saturdays, 10am – 2pm | June 6 – Oct 10, 2026 + Nov 21 & Dec 5
W McGraw St & 33rd Ave W | Seattle
seattlefarmersmarkets.org/mfm
Phinney
A popular gathering spot for both the Phinney Ridge and Greenwood communities, this market is right next door to a playground and offers live music in addition to the great mix of fresh produce and prepared food.
Fridays, 3pm – 7pm | June 5 – Sept 25, 2026 + Harvest Market on Nov 20
6532 Phinney Ave N | Seattle
seattlefarmersmarkets.org/pfm
Pike Place
Produce on Pike extends the standard market with pop-up tents from local farmers along the north end of Pike Place. Of course, you can come enjoy the historic indoor market any time…make it a day with great restaurants, eateries and retail shops, too.
Produce on Pike Farmers Market:
Wednesdays, 3pm – 7pm | June 24 – Sept 9, 2026
Stewart Street & Pike Place | Seattle
pikeplacemarket.org/farmers-markets
Indoor Market:
Daily, 9am – 6pm (farm tables close at 4pm) | Year-Round (Closed Thanksgiving & Christmas)
Pike Place between Pine & Virginia St | Seattle
(206) 682-7453
pikeplacemarket.org
Queen Anne
Seattle’s only independent farmers market, offering food, chef demos, live music, and children’s activities.
Thursdays, 3pm – 7:30pm | May 28 – Oct 8, 2026
Spring Preview Market on Sat, May 9, 2026, 10am-3pm
Saturday Harvest Markets on Oct. 31 & Nov. 21, 10am-3pm
Queen Anne Ave N & W Crockett St | Seattle
qafm.org
Shoreline
Now located at the BikeLink Park & Ride (corner of 192nd & Aurora, across from Sky Nursery), this market offers kids’ programs and live music in addition to its fresh Washington produce, organic meats, bread, honey, and prepared foods.
Saturdays, 10am – 2pm | June 6 – Oct 31, 2026
18821 Aurora Ave N | Shoreline
shorelinefarmersmarket.org
South Lake Union – Mini Thursday Market
Affiliated with Pike Place Market, this small satellite market offers locally sourced veggies, fruits, flowers, honey, jam, and organic meats from the region’s finest farms.
Thursdays, 10am – 2pm | June 4 – Oct 29, 2026
426 Terry Avenue N | Seattle
pikeplacemarket.org/farmers-markets/
South Lake Union – Saturday Market
This year, the former maker’s market is evolving into a full blown farmers market complete with over 100 booths and Space Needle views.
Saturdays, 10am – 3pm | June 6 – Nov 21, 2026
2100 6th Ave | Seattle
slumarket.com
University District
Come visit Seattle’s largest and oldest farm/food only market, regularly recognized as one of the best farmers markets in the U.S.! With over 80 booths and hard-to-find ingredients, it’s a chef’s delight.
Saturdays, 9am – 2pm | Year-Round
University Way NE (the “Ave”) between 50th & 52nd | Seattle
seattlefarmersmarkets.org/udfm
Wallingford
Located in Meridian Park, you can shop with the whole fam and then enjoy a picnic or playtime at the award-winning playground.
Wednesdays, 3pm – 7pm | May 27 – Sept 30, 2026
4800 Meridian Ave N | Seattle
sfmamarkets.com/visit-wallingford-farmers-market/
West Seattle
A weekend destination for families across the area, this market is set in the vibrant West Seattle Junction and features 90+ vendors during the summertime peak. Great community atmosphere celebrating Washington grown food and ingredients.
Sundays, 10am – 2pm | Year-Round
California Ave SW & SW Alaska | Seattle
seattlefarmersmarkets.org/wsfm
Greater Eastside
Bellevue – Crossroads
East Bellevue’s market features fruits, veggies & dairy products from Washington state farms along with hand crafted bird houses, candles, dog accessories, herbal wellness products, and more. Don’t miss the tacos, Nepalese street food, and handmade ice cream sandwiches, too!
Tuesdays, 12pm – 6pm | June 2 – Sept 29, 2026
15600 NE 8th St | Bellevue
https://crossroadsbellevue.com/music-events/crossroads-farmers-market/
Bellevue – Downtown
Set in the heart of Downtown Bellevue, this market offers goods exclusively produced within Washington state—from seasonal fruits & veggies to flowers, fresh meats, artisan goods, and prepared cuisine. The Power of Produce (POP) club empowers kids to know where their food comes from and make healthy eating choices.
Thursdays, 3pm – 7:30*pm | May 21 – Oct 1, 2026
*Closes at 7pm in Sept & Oct
Harvest Market: Nov 21, 10am – 3pm
1717 Bellevue Way NE | Bellevue
bellevuefarmersmarket.org
Carnation
Set in the heart of the Sno-Valley farming district, you’ll find plenty of freshly picked produce along with live music and educational activities for the kids.
Tuesdays, 3pm – 7pm | June, July & August 2026
Tolt-MacDonald Park, 31020 NE 40th St | Carnation
carnationfarmersmarket.org
Duvall
Nestled alongside the scenic Snoqualmie River, this friendly market features local eggs, jams, fresh roasted coffee, arts, crafts, and baked goods in addition to the seasonal veggies, fruits, and plant starts. Live music, picnic shelters and a playground make this a fun family destination.
Thursdays, 3pm – 7*pm | May 7 – October 8, 2026
*Closes at Sunset in October
Taylor Landing at 16201 Main St NE | Duvall
Parking Map
duvallfarmersmarket.org
Issaquah
Located at the historic Pickering Barn, this picturesque venue offers a variety of fresh farm and food-based products, concessions, and local artisans.
Saturdays, 9am – 2pm | May 2 – Sept 26, 2026 + Holiday Market Dec 12
Pickering Barn, 1730 10th Ave NW | Issaquah
Market Map
www.issaquahwa.gov/778/Farmers-Market
Kirkland – Downtown
This stunning setting on the Lake Washington shoreline turns shopping into a day at the beach. Peruse local produce and goods, then go for a swim or stroll along Moss Bay. Perfect for a picnic, too!
Wednesdays, 3pm – 7pm | June 3 – September 30, 2026
Marina Park, 25 Lakeshore Plaza | Kirkland
kirklandmarket.org
Kirkland – Juanita
Set in beautiful Juanita Beach Park on Lake Washington, you’ll find as many as 30 vendors offering farm fresh local produce, herbs, honey, nuts, flowers, plants, baked good, handcrafted items, and prepared cuisine. Make it a date with live music and a picnic at the beach. There’s a great playground for the kids, too.
Fridays, 3pm – 7pm | June 5 – Sept 25, 2026 (Closed June 19 & July 3)
Juanita Beach Park, 9703 NE Juanita Dr | Kirkland
www.kirklandwa.gov
Mercer Island
Come on down for quality local Washington state produce, cheese, fish, meat, bread, and more. Check out the live music schedule, too!
Sundays, 10am – 2pm | May 31 – Oct 11, 2026
Mercerdale Park, 7700 SE 32nd St | Mercer Island
www.mifarmersmarket.org
North Bend
This relaxed market enjoys live music and a spectacular Mount Si view. Vendors offer fresh produce, berries, honey, flowers, baked goods, hand-crafted items, and delicious prepared foods. Kids can participate in the Power of Produce (PoP) Club. Two playgrounds plus play fields and a covered picnic shelter make this a fun hangout spot. Leashed pets are welcome, too!
Thursdays, 4-8*pm | June 4 – Sept 3, 2026
*3:30 pm – 7:30 pm on Aug 27 & Sept 3
Si View Park, 400 SE Orchard Dr | North Bend
www.siviewpark.org/farmers-market.phtml
Redmond
Going strong since 1976, the Redmond Saturday Market offers a huge selection of vendors and dazzling array of produce, flowers, cheeses, preserves, salmon, tea, and handmade goods such as pottery and soaps. You’ll love the ready-to-eat foods, too.
Saturdays, 9am – 2pm | May 2 – Oct 31, 2026 (Closed May 9th)
9900 Willows Rd NE | Redmond
www.redmondsaturdaymarket.org
Renton
Find exclusively Washington-produced fruits, veggies, handmade goods, arts, crafts and more right in the heart of downtown Renton. Food trucks, live music, and kids’ activities make this a fun spot to liven up your Tuesday. Note: for 2026, the market returns to Piazza Park!
Tuesdays, 3pm – 7pm | June 2 – Sept 29, 2026
Piazza Park at 233 Burnett Ave S | Renton
www.rentonfarmersmarket.com
Sammamish
Each Wednesday, the Sammamish Commons plays host to a variety of local farmers, nurseries, bakeries, artisans, food vendors, and more. Live music and kids’ activities, too! Check out their special themed days including Soccer Fest and Pride Day.
Wednesdays, 4-8*pm | May 6 – Sept 9, 2026
*3-7 pm in Sept
Sammamish Commons, 801 228 Ave SE | Sammamish
Parking: Mary, Queen of Peace Catholic Church, 1121 228th Ave SE
www.sammamishfarmersmarket.org
Woodinville
Come check out downtown Woodinville’s Schoolhouse District and find produce grown in the state of Washington (and picked fresh for that morning!). You’ll also have an array of boutique baked goods, sauces, cider, artisans, and more to peruse.
Saturdays, 10am – 2pm | May 2 – Sept 26, 2026
13205 NE 175th St | Woodinville
woodinvillefarmersmarket.com
Find a Home | Sell Your Home | Property Research
Neighborhoods | Market Reports | Our Team
We earn the trust and loyalty of our brokers and clients by doing real estate exceptionally well. The leader in our market, we deliver client-focused service in an authentic, collaborative, and transparent manner and with the unmatched knowledge and expertise that comes from decades of experience.
2737 77th Ave SE, Mercer Island, WA 98040 | (206) 232-0446
mercerisland@windermere.com
© Copyright 2026, Windermere Real Estate/Mercer Island.
Cut the Clutter: Donation & Recycling Locations Around the Sound

Spring is coming, and with it comes a chance to clear out the old and start fresh—whether it’s those ever-growing piles in your garage and attic, that closet you can barely close, or a horror-movie-inspired basement. Here are resources to reclaim your space and put your unwanted items to good use (or recycle and give them their own fresh start)…
Donations | Recycling | Disposal
Donations
CHILDREN’S HOSPITAL BARGAIN BOUTIQUE
Furniture/furnishings, jewelry, antiques, collectibles, and new or gently used men’s, women’s or children’s clothing. Be sure to check items they don’t accept.
seattlechildrens.org/giving/bargain-boutiques
Estates: (206) 327-3067
Vehicles: (888) 205-8941
Bainbridge Island: 1050 Hildebrand Lane, Suite G-1 | Bainbridge Island, WA 98110 | (206) 842-5567
Olympia: 2020 Harrison Ave. NW | Olympia, WA 98502-5097 | (360) 236-8245
GOODWILL
Accepts donations of a wide range of items, from exercise equipment, to clothes and home decor items and furniture. Net proceeds help fund job training and education programs.
evergreengoodwill.org/donate-goods
KIDVANTAGE
Donate your quality used children’s clothing, shoes, baby gear, toys, books, bedding, and maternity clothing. You’ll help to fill the nearly 4,000 orders of essentials that they provide to underprivileged children and expectant moms each week.
Issaquah: 1510 NW Maple St. | Issaquah, WA 98027 | (425) 865-0234
Shoreline: 17230 12th Ave NE | Shoreline, WA 98155 | (425) 209-1136
Bremerton: 1463 NE Dawn Road, Suite B | Bremerton, WA 98311 | (360) 616-0235
MARY’S PLACE
Gratefully accepts gently used clothing, luggage, twin size sheets/blankets, paperback books, and small household items (dishware, utensils, mugs, and small appliances such as microwaves) to distribute to families in need.
marysplaceseattle.org/get-involved/share-your-stuff
Donation Center: 4521 6th Ave S. | Seattle, WA 98108
Shelter (small donations only): 720 Blanchard St, Seattle
NORTHWEST CENTER
Big Blue Trucks accept clothing, household goods, sporting goods, tools, toys & more to support people with disabilities. Here’s what they do and don’t take.
bigbluetruck.org/drop-off-locations
NORTHWEST FURNITURE BANK
Furniture bank for homeless families in transition in South King County and Pierce County. Here’s what they accept and you can arrange a pickup if you live within a 25 mile radius of Tacoma.
117 Puyallup Ave | Tacoma, WA 98421 | 253-302-3868
SAINT FRANCIS HOUSE
Accepts clean, gently used clothing for men, women & children as well as kitchen & household items. All donations are passed on directly to those in need.
stfrancishouseseattle.org/support-us
169 12th Ave | Seattle, WA 98122 | 206-268-0784
SAINT VINCENT DE PAUL
Drop off your sorted donations of gently used clothing, housewares, toys, shoes/accessories, linens, books, and electronics to one of their thrift stores (here’s what they don’t accept). $0.89 of every dollar funds programs that provide neighbors with food, clothing, eviction prevention, case management, and more.
SEATTLE’S UNION GOSPEL MISSION
Accepts food, clothing, furniture, vehicles & housewares in their mission to support our homeless neighbors.
Distribution Center: 8226 South 208th Street, Suite G110 | Kent, WA 98032 | (206) 723-5700
Furniture Pick-Up: (507) 593-7024
Recycling/Disposal
E-CYCLE WASHINGTON
WA Department of Ecology’s free program for residents to recycle electronics (including TVs, computers, monitors, tablets, & more), with participating locations across the state.
FRIENDLY EARTH
Free recycling of electronics, flat screen TVs/monitors, appliances, BBQs, computers, lawn equipment/tractors, motorcycles, & more! Recycling with a fee for copiers/printers, refrigerators, A/C units, solar panels, & large rear-projection TVs. Paid data destruction available as well. Get the full scoop here.
1560 1st Ave S. | Seattle, WA 98134
(206) 367-4111
ONE GREEN PLANET
Free recycling of electronics, computers, copiers, printers, ink/toner, appliances, bikes/scooters, scrap metal, machinery, phones/chargers, & more. Recycling with a fee for appliances containing Freon, flat screen TVs, tapes/CDs/floppy disks, alkaline batteries, & X-ray film. Here’s the full list.
851 Houser Way North, Suite B | Renton, WA 98057
(425) 996-3513
RECOLOGY
With a zero waste goal, Recology stores accept hard to recycle items like CFL light bulbs, household batteries, hard-cover books, small electronics/appliances, block Styrofoam, and bicycles. Here’s the fee list for non-customers (if you’re already signed up for their curbside service, you can drop off limited quantities for free).
Issaquah: 317 NW Gilman Blvd, #22 | Issaquah, WA 98027
Highline: 15858 First Avenue S, #A100 | Burien, WA 98148
Shoreline: 15235 Aurora Ave. N | Shoreline, WA 98133
RUBBISH WORKS
Removal of nonhazardous materials for eco-friendly disposal—up to 50% of hauled away materials are recycled and the rest is donated when possible.
(888) 594-5078
Find a Home | Sell Your Home | Property Research
Neighborhoods | Market Reports | Our Team
We earn the trust and loyalty of our brokers and clients by doing real estate exceptionally well. The leader in our market, we deliver client-focused service in an authentic, collaborative, and transparent manner and with the unmatched knowledge and expertise that comes from decades of experience.
2737 77th Ave SE, Mercer Island, WA 98040 | (206) 232-0446
mercerisland@windermere.com
© Copyright 2025, Windermere Real Estate/Mercer Island.
How’s the Market? Annual Review of Seattle Area Real Estate

Happy New Year! Whew, we made it! With 2024 now in the books, we’re looking back fondly on a real estate market that showed positive signs of growth in virtually every sector. Median sales prices posted strong double-digit gains on the Eastside along with a healthy 8% rise in Seattle. Listings also rose, easing the strain for buyers grappling with our housing shortage.
If you’ve waited long enough and 2025 is the year for you to make a move, we recommend front loading that decision. Pent up demand (both sellers waiting to sell and buyers waiting to buy) should give us a spring full of blossoming and beautiful inventory. There is less volatility in interest rates than there has been in recent months, you’ll see that the average rate has been rock steady around 6.75% in 2023 and 2024. Overall, this is a great time to buy or sell and I know your real estate professional is excited to help you!
Click or scroll down to find your area report:
Seattle | Eastside | Mercer Island | Condos | Waterfront
SEATTLE
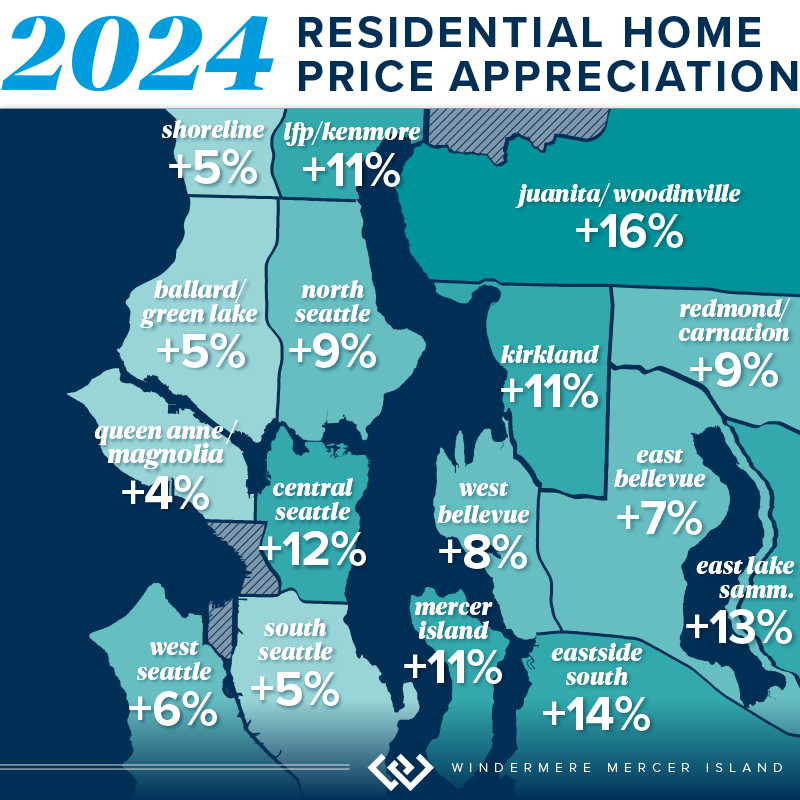
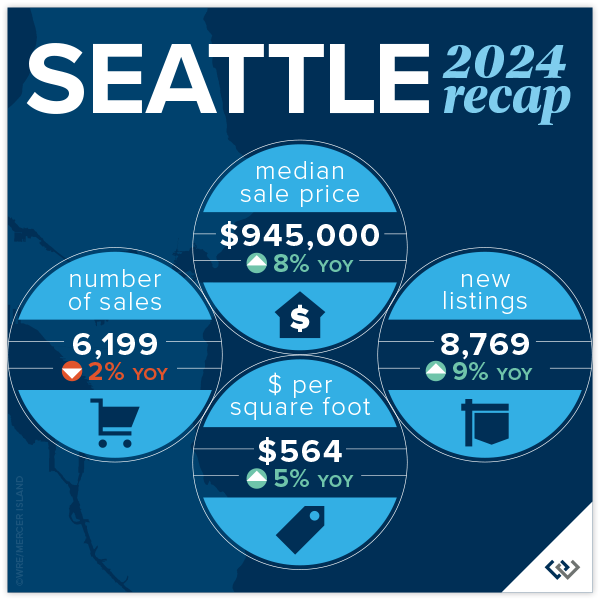
From a statistical/real estate perspective, the numbers don’t really reflect the overall vibe of the year. In a good way! It’s all positive news: prices are up, listings are up, and market time is down. The City of Seattle is in full recovery mode. Homeowners are awaiting the new density plan and eager to learn what the city has in store for the core neighborhoods around transit. It’s an exciting time. Median sold price city-wide reached a record $945,000 (modest, as that is $5000 above the previous record set in 2022) and homes sold for an average 104% of list price when they attracted a sale in the first 10 days (58% of the total sales).
Lake Forest Park and Madison Park saw the greatest price gains at 11% and 12% respectively. North Seattle was over all the “strongest” with 66% of homes selling in the first 10 days and 70% of homes selling for at or above list price. There was a modest gain in new listings across the board at 8769, while still lower than typical. The ten-year average is around 10,500 listings per year. No bad news here with average price per square foot gains of 5% to $564!
 Click here for the full report and neighborhood-by-neighborhood statistics!

EASTSIDE
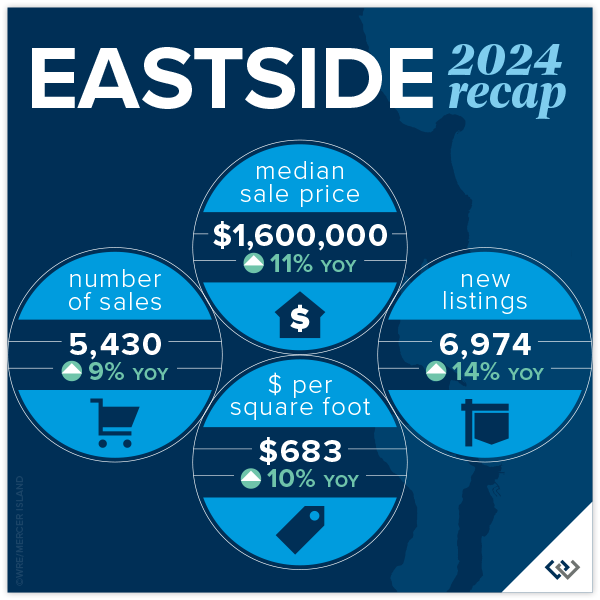
Welcome 2025! We (the real estate community) are feeling hopeful and bullish about what’s to come. So far, the numbers year over year support that. When we reviewed 2023 for the Eastside, the only positive statistic reported was Mercer Island’s 2% rise in the number of home sales. Looking at the 2024 report with that perspective it is ALL good news. New listings are up 14% for the year, while the number of sales are up nearly 10%. This is absorption of inventory to be excited about. Prices are up 11% to a record high of $1,600,000!
Woodinville and the area S of I-90 saw the largest price gains at 16% and 14% respectively, likely enjoying the benefits of buyers ‘pushing out’ because of the pressure of affordability in the core neighborhoods. Kirkland and West Bellevue were among the highest total sales and still a strong showing in price gains at 11% and 8%. Even though Bellevue (E of 405) saw the most modest price gains this was arguably the most popular neighborhood with 74% of homes selling in the first 10 days and 71% selling for at or above asking price!
 Click here for the full report and neighborhood-by-neighborhood statistics!
MERCER ISLAND
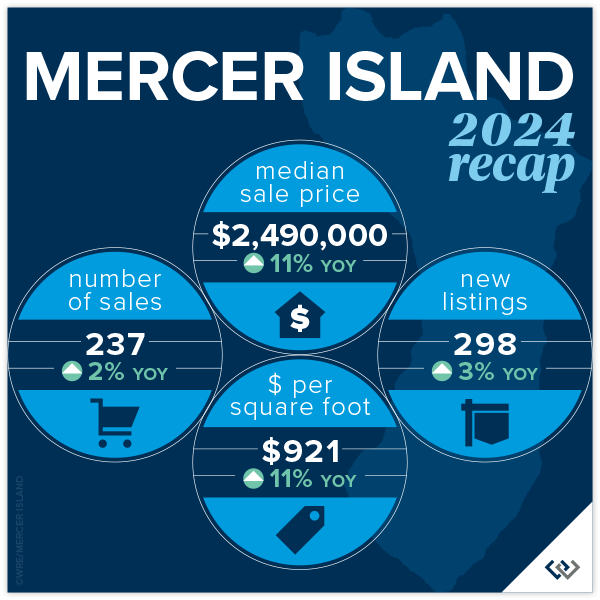
2024 was a solid year for Mercer Island: 11% overall price growth, on average 98% list to sales price ratio, and a respectable 32 cumulative days on market. This was a year of calm and confident decisions made by the entire real estate market. Home buyers and sellers alike. Looking to the neighborhoods there were two that stood out in relation to 2023: The Eastside and The Lakes where total sales had massive growth. 26 homeowners (vs 11 in 2023) moved on the Eastside and in the Lakes there were 4 transactions, a whopping change given that there were no sales reported on the MLS in 2023. The Island has not yet reached the peak prices from 2022, but we’re on our way!
Shifting to the condo market, 2024 was a sleepy year. With 47 new listings and 33 sales (both about 20% lower than in 2023), the average list to sales price ratio of 101% surprised us! Total median price is down YOY by about 8%, but with such little data to draw from this number tends to swing more than most. The overall price swing was from $339,000 for a studio to $1,775,000 for a 2 bedroom luxury unit. 19 of the 33 sales were 2 bedroom units. All in all condos on the island are a necessary market segment that we continue to watch closely as an overall indicator of market health.
 Click here for the full report and neighborhood-by-neighborhood statistics!
CONDOS – SEATTLE & EASTSIDE
In reviewing last years’ report, there was so much RED! This year is a refreshing change with some positive numbers sprinkled in. Even the pockets that remain flat feel like good news, after all, a push is a win! Perspective is everything, in life and in real estate. This year was absolutely a bright spot for condos in the last several months. This was due in large part to external factors: affordability issues in single family, perceived ‘high’ interest rates, continued density issues in the ‘burbs, and major employers recall to office. Urban life in both Seattle and on the Eastside are experiencing a renaissance and we’re here for it!
The headline in Seattle is that prices are UP! Downtown saw an increase of 8% to a median price of $650,000. Though, North Seattle carried the day with an eye popping 18% increase in median price. While price per square foot was flat on average, new listings are up 21% YOY. Sellers are dipping their toes back in the market at higher prices (up 5.3%) and seeing moderate success with total sales down 3% (compared to a 26% drop in 2023). Buyers know they have options and will wait to pick off the low hanging fruit: best perceived value for their dollar.
Meanwhile, on the Eastside: prices are up, listings are up, sales are up. A nice headline, but let’s break it down. New listings rose a whopping 34% year over year (which you may remember saw a 23% dip from 2022). Demand was steady with total sales up 15% YOY; we didn’t quite absorb all of the new inventory but that is to be expected. So, even with a relatively high absorption rate prices rose to a record high median of $695,000. The stars of this price gain are, not surprisingly, Kirkland and West Bellevue at 28% and 24% respectively. We can’t wait to see what 2025 will bring!
Check out area-by-area details the full condo report.

WATERFRONT
The Eastside saw a huge boost in waterfront sales with 50% more sold in 2024 than 2023. Mercer Island and Lake Sammamish posted similar sales gains of 45% and 43% respectively. While Seattle had 2 fewer sales than the year prior, its waterfront homes sold faster than in any other area and fetched higher selling prices as compared to list prices.
The highest waterfront sale was $38,900,000 for an immense 13,590 sq. ft. Medina estate on 117 feet of Lake Washington shoreline. The most modest sale was $1,400,000 for a 1960 Ralph Anderson original on Seattle’s Arroyo Beach.
This brief overview of the entire Seattle-Eastside private waterfront market, including Mercer Island and Lake Sammamish, illustrates the trends occurring in our region over time. This data is interesting and insightful but cannot replace an in-depth waterfront analysis with your trusted professional.

Find a Home | Sell Your Home | Property Research
Neighborhoods | Market Reports | Our Team
We earn the trust and loyalty of our brokers and clients by doing real estate exceptionally well. The leader in our market, we deliver client-focused service in an authentic, collaborative, and transparent manner and with the unmatched knowledge and expertise that comes from decades of experience.
2737 77th Ave SE, Mercer Island, WA 98040 | (206) 232-0446
mercerisland@windermere.com
© Copyright 2025, Windermere Real Estate/Mercer Island. Information and statistics derived from Northwest Multiple Listing Service and Trendgraphix, and deemed accurate but not guaranteed. Seattle cover photo courtesy of Michael Fleming and Clarity Northwest Photography. Mercer Island cover photo courtesy of The Sirianni Group and Clarity Northwest Photography. Condo cover photo courtesy of Luke Bartlett and Matthew Gallant, Clarity Northwest Photography.
How’s the Market? Q3 2024 Review of Seattle Area Real Estate

While Q3’s summertime market slowed a bit from the frenetic spring pace of Q2 (we call this the “Summer Slump”), median home values are up across the region compared to this time last year. Most homes still sold at or above their listed prices in the first 10 days on market. However, buyers had more choice with higher inventory levels AND some room to negotiate on price for those homes that stayed on the market past the 10-day mark.
What does this mean for the rest of 2024? We typically see buyer activity decrease as we head into the holidays, and of course, it’s also election season. If you’ve been considering a purchase and are of the mindset that you don’t want to compete, THIS IS YOUR MARKET! For sellers the average days on market in Q3 was 20 for Seattle and 18 for the Eastside. Which means: if your price didn’t attract a buyer in the first two weeks, it’s probably time to re-evaluate. Interest rates are better than they’ve been since mid 2022. Quality inventory is being presented to the market. If you see a great house, be prepared to move quickly. Opportunity Knocks.
Click or scroll down to find your area report:
Seattle | Eastside | Mercer Island | Condos | Waterfront
SEATTLE
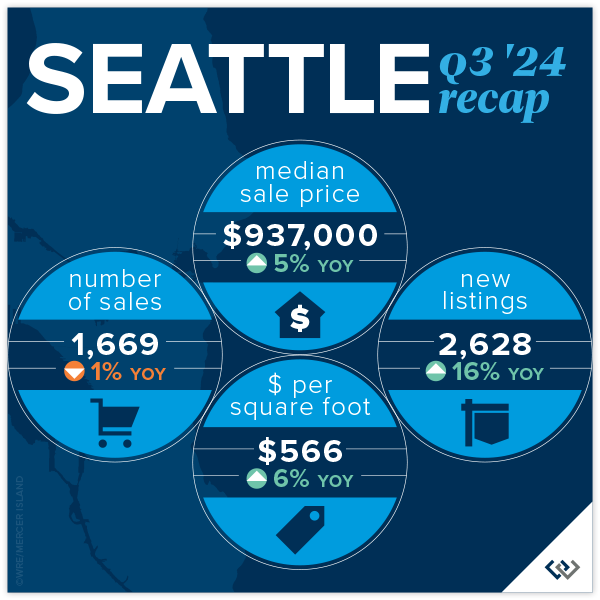
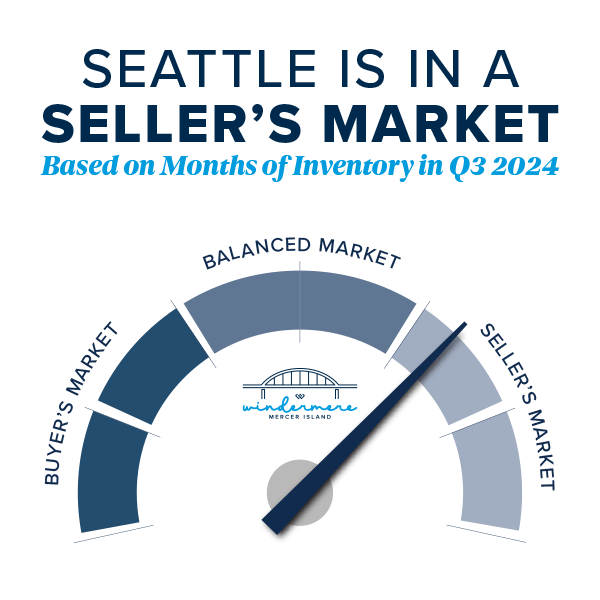
Lots of good news in Seattle during our post-summer glow. Prices are up year over year by 5% to $937,000. While we’re still under the peak median of $1,000,000 set in Q2 of 2022 and $970,000 from last quarter, this is so typical for Q3. We’ve seen it every year from Q2 to Q3 going back to 2018 (except in 2020 largely because the real estate market shut down completely in Q2). Buyers had lots of choice, with more inventory to end the quarter than we’ve had since Q3 of 2022. Even with these buyer bright spots we still saw 56% of homes sell in the first 10 days and 34% over the asking price.
Average price per square foot and median price were in positive territory across the board this quarter in all neighborhoods. Richmond Beach/Shoreline and Madison Park/Capitol Hill both saw larger than typical gains in $/sq.ft. (11%) and median price (10%) respectively. North Seattle appeared to be the “hottest” market around with 64% of homes selling in the first 10 days. Again, really great numbers in Seattle given that Summer Slump was in full effect.
 Click here for the full report and neighborhood-by-neighborhood statistics!

EASTSIDE
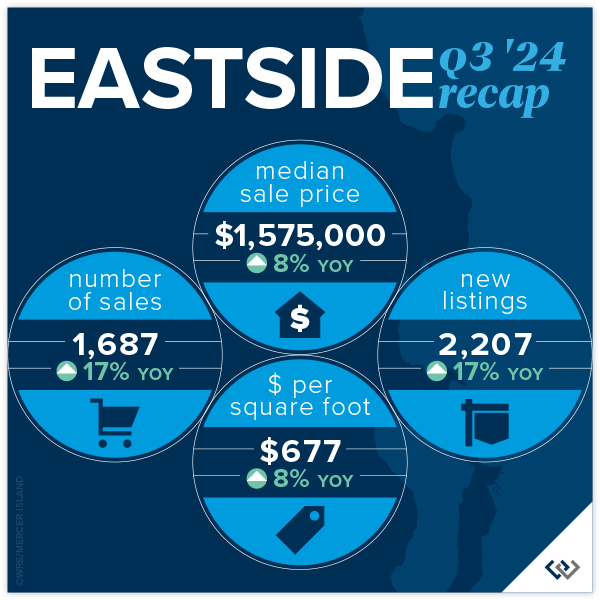
The Eastside continues to be the region’s crown jewel of real estate. Median prices are up again year over year by 8%. Most of us felt what we lovingly call the Summer Slump, and the numbers confirmed this. Prices (median) AND transactions were down 6% overall when compared against Q2 of 2024. That’s a $100,000 dip in median sales price if you missed the spring market. This is absolutely typical for the PNW and Metro King County. Seasonally our peak seasons are spring and post Labor Day/pre-holiday. This year that may be disrupted by election distractions. Time will tell if it’s a market lacking in consumer confidence or simply existential distraction.
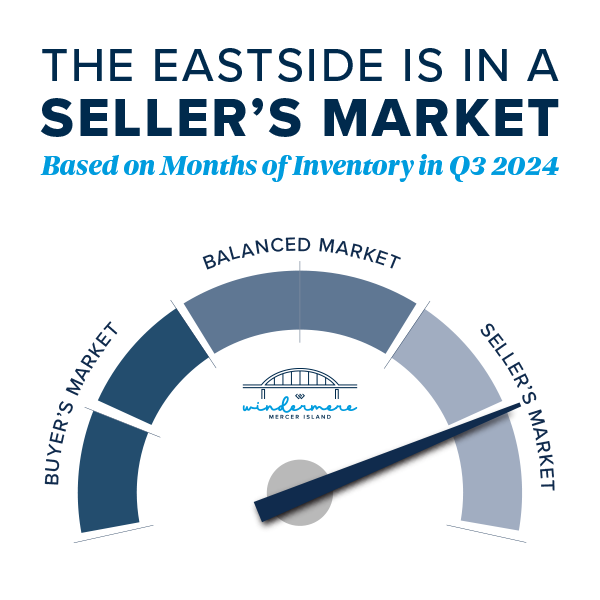
The micro markets across the Eastside are fairly homogeneous. Among the 8 neighborhoods that we track, the median price swing was 3-11% but all in a positive direction. Total transaction volume is up 18% signaling that eventually life changes will trump a 2.5% interest rate. While homes were mostly selling in the first 10 days, multiple offers/paying over asking price were not the norm. In fact, the split between at, above, and below was relatively even.
 Click here for the full report and neighborhood-by-neighborhood statistics!

MERCER ISLAND
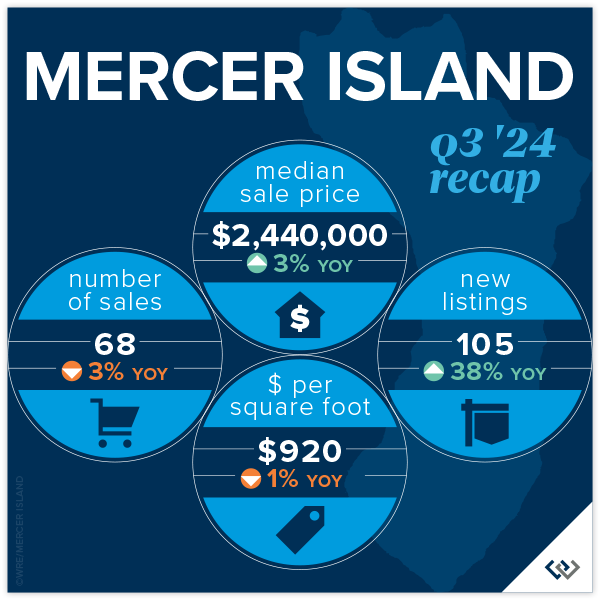
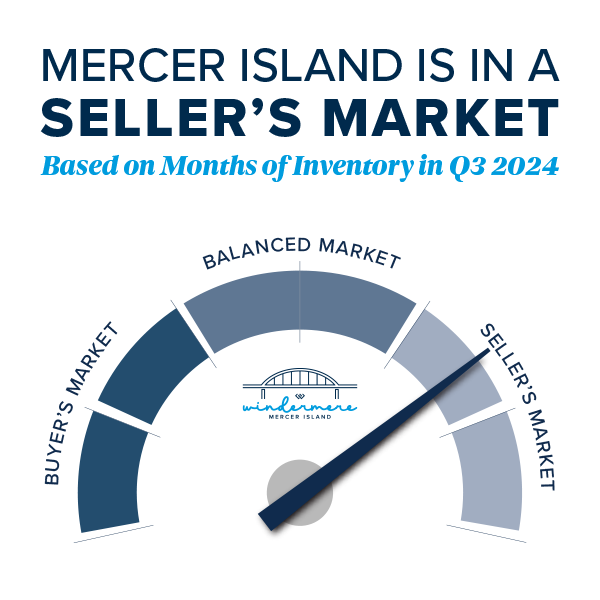
Fall has come for Mercer Island. The summer construction on Island Crest is done, school buses are out en force, and those filtered views that only come out in winter are starting to show. It’s time to look back fondly at the summer real estate market: prices are up YOY by 3% to $2,440,000 to end the quarter. This is likely more about trailing gains from a robust spring than it is about actual gains from Q3, given the indicators. A whopping 40% of homes sold under list price. It took 40% longer than 10 days to sell (not necessarily the same 40%) but only for about a 2% discount. This suggests that seller pricing and buyer motivation are evenly matched. There were 50 active listings at end of quarter, the most since Q2 of 2020 when real estate shut down completely.
Focusing on neighborhoods, The Lakes, Mercerwood, Mercerdale, and Mercer Island Estates saw 100% of homes sell in the first 10 days for an average of 102% of sales price. This goes to show that in any market, despite overall conditions, there will always be “hot homes.” Mid-Island had the most overall activity with 22 of the 68 sales across the Island. These occurred at $865/foot and 16 of the 22 homes sold in the first 10 days for at or above list price.
 Click here for the full report and neighborhood-by-neighborhood statistics!

CONDOS – SEATTLE & EASTSIDE
Once again, we’re rooting for the Seattle condo market as it proves to be the little engine that could! Chugging along toward modest price gains even when the rest of the market seems to be struggling a bit, Seattle condo prices have held steady for the last 6 quarters, with mostly positive change. Eastside condos hit a median price all-time high in Q2 at $709,000. We’re off of that a touch to $690,000 in Q3, to be expected after a beautiful summer. The Eastside ended the quarter with 29% more listings than this time last year and only 13% more sales. Mounting inventory tends to lead to price softening. Overall, nearly 50% of condos sold for at or above their list price!
When you compare the charts in the report, there is admittedly more positive news on the Eastside than in Seattle. Overall, we’re encouraged that despite many neighborhoods experiencing a drop in sales, average price per sq. ft. held flat and median price is up overall. On the Eastside it’s still great news all around for the market, especially in West Bellevue with 26% median sales price gains and total sales up 55%.
Friendly PSA: PLEASE remember that there is a ‘first rung’ of the property ladder. CONDOS create an affordable option to start building wealth at a younger age. It’s an important real estate product that has been overlooked. I am hopeful that enterprising young homeowners return to the condo market in droves this next real estate cycle.
Check out area-by-area details the full condo report.
WATERFRONT
While a bit slower compared to last quarter, waterfront sales remained strong in Q3 with 10 on the Eastside and 8 in Seattle. Lake Sammamish moderated in summer with just 5 sales compared to the crazy 15 we saw in spring, while Mercer Island stayed fairly steady with 4 (compared to 6 in spring). The highest sale was nearly $18 million for an immense Wendell Lovett designed 6,920 sq. ft. home on 125 feet of prime “gold coast” waterfront in Medina. The most modest sale was also on the Eastside—an original 1943 cottage on 53 feet of west-facing waterfront in Kennydale.
This brief overview of the entire Seattle-Eastside private waterfront market, including Mercer Island and Lake Sammamish, illustrates the trends occurring in our region over time. This data is interesting and insightful but cannot replace an in-depth waterfront analysis with your trusted professional.
Find a Home | Sell Your Home | Property Research
Neighborhoods | Market Reports | Our Team
We earn the trust and loyalty of our brokers and clients by doing real estate exceptionally well. The leader in our market, we deliver client-focused service in an authentic, collaborative, and transparent manner and with the unmatched knowledge and expertise that comes from decades of experience.
2737 77th Ave SE, Mercer Island, WA 98040 | (206) 232-0446
mercerisland@windermere.com
© Copyright 2024, Windermere Real Estate/Mercer Island. Information and statistics derived from Northwest Multiple Listing Service and Trendgraphix, and deemed accurate but not guaranteed. Seattle cover photo courtesy of Kathryn Buchanan and Brandon Larson, Clarity Northwest Photography. Mercer Island cover photo courtesy of The Sirianni Group and Clarity Northwest Photography. Condo cover photo courtesy of Julie Wilson and Bobby Erdt, Clarity Northwest Photography. Waterfront cover photo courtesy of Anni Zilz and Andrew Webb, Clarity Northwest Photography.
Property Tax Relief Programs in King County

Updated 2/2025
More than 26,000 low-income seniors and disabled people in King County who qualify for a tax exemption haven’t claimed it…are you or your family member one of them?
If you are homeowner, make $84k or less per year, and are either age 61+, retired due to disability, or 57+ and the surviving spouse/domestic partner of an exemption participant, there is a good chance you qualify. You can even retroactively apply for the exemption for the prior 3 years!
Scroll down for details on this exemption plus 4 other property tax relief programs that King County offers.
In another county? Here is the full list of income thresholds for every county in Washington State, and here is another link to view the programs each county offers.
Senior/Disabled Property Tax Exemption
WHAT IS IT?
A reduction in King County property tax for seniors, people with disabilities, and disabled veterans.
WHO QUALIFIES?
- Seniors age 61+
or
- Those who cannot work due to a disability
or
- Veterans with service-related disabilities (evaluation of at least 80% or receiving compensation from the VA at the 100% rate)
or
- Those who are age 57+ AND a surviving spouse/domestic partner of an exemption participant who was enrolled at the time of their death
YOU MUST…
- Own your home
- Have occupied it as a primary residence at least 6 months out of the year
INCOME LIMIT
- $84,000 maximum annual household income for the previous year in King County (click here for other counties)
WAYS TO APPLY
- Click here to apply online
- Call 206-296-3920
- Ask your local senior center if they help with applications
Senior/Disabled Property Tax Deferral
WHAT IS IT?
The ability for seniors & disabled people to defer unpaid property tax/special assessments, including back taxes for as long as you’ve owned the home. Deferred taxes + any accumulated interest then become a lien on the property until it’s repaid.
WHO QUALIFIES?
- Seniors age 60+
or
- Those who cannot work due to a physical disability
YOU MUST…
- Own your home and have lived in it for more than 9 months in a calendar year
- Meet an equity requirement
INCOME LIMIT
- $88,998 maximum annual household disposable income in King County (click here for other counties)
HOW TO APPLY
- Call 206-263-2338
MORE TAX RELIEF PROGRAMS…
Limited Income Deferral
WHAT IS IT?
The ability to defer the second installment of your property taxes/special assessments (normally due October 31st) if you are a low-income homeowner. The deferred taxes plus interest become a lien on the property until they’re repaid.
YOU MUST…
- Have owned your property for 5 years
- Be living in the home as of January 1st of the application year AND more than 9 months during that year
- Meet an equity retirement
- Have already paid the first half of your taxes (due April 30th)
INCOME LIMIT
- $57,000 maximum annual household income in the previous year (all counties in Washington State)
HOW TO APPLY
Homeowner Improvement Exemption
WHAT IS IT?
Relief from tax increases caused by major additions or remodels.
YOU MUST…
- Own a detached single family dwelling (including mobile homes)
- File your claim for exemption with the assessor BEFORE construction is complete
HOW TO APPLY
- Call 206-263-2338
Flood & Storm Damage Property Tax Reduction
WHAT IS IT?
Tax relief for property damaged by something beyond the owner’s control. Eligible properties receive a reduction of assessed value resulting in lower property taxes. In addition, taxpayers can receive an exemption to keep taxes lower for the 3 years after they rebuild.
YOU MUST…
- Have your property on the assessment roll as of January 1st in the year it was damaged
- Have property that was destroyed, OR was in a declared disaster area and reduced in value by more than 20% as a result of the disaster
HOW TO APPLY
- Complete a Destroyed Property Claim Form and file it with King County Dept of Assessments within 3 years of the damaging event
- Call 206-263-2332 with questions
For more information on any of these programs, visit the King County Assessor’s tax relief page. You can also find info for other counties on the WA Dept of Revenue website.
Find a Home | Sell Your Home | Property Research
Neighborhoods | Market Reports | Our Team
We earn the trust and loyalty of our brokers and clients by doing real estate exceptionally well. The leader in our market, we deliver client-focused service in an authentic, collaborative, and transparent manner and with the unmatched knowledge and expertise that comes from decades of experience.
2737 77th Ave SE, Mercer Island, WA 98040 | (206) 232-0446
mercerisland@windermere.com
© Copyright 2023-2025, Windermere Real Estate/Mercer Island.