 Facebook
 X
X
 Pinterest
 Copy Link
How’s the Market? Q1 2026 Review of Seattle Area Real Estate

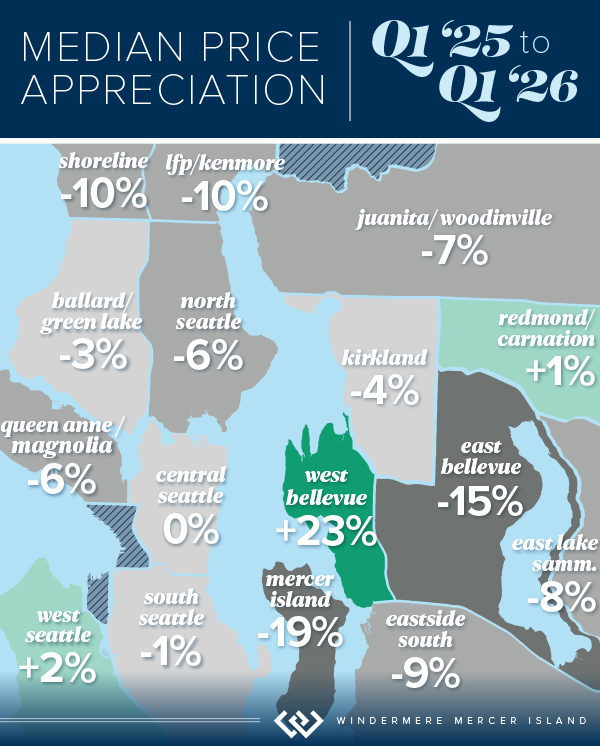
Across the region, median sales prices were lower than we saw at this time last year. The likely cause: more homes are hitting the market, but buyers (rattled by rising rates, layoffs, and an uncertain economy) aren’t keeping pace. That being said, we are still seeing many homes sell in their first 10 days on market with the choicest homes drawing multiple offers and selling above the asking price. The market is complex and every home is different…as agents, we have to look beyond the averages to get a clearer understanding of what is happening at the neighborhood level.
Despite the push in interest rates, it continues to be a good time to invest and find the right home! Buyers who are up-sizing have a special advantage when prices dip since the money they save on their purchase often exceeds the lower ROI from their sale.
Click or scroll down to find your area report:
Seattle | Eastside | Mercer Island | Condos | Waterfront
SEATTLE
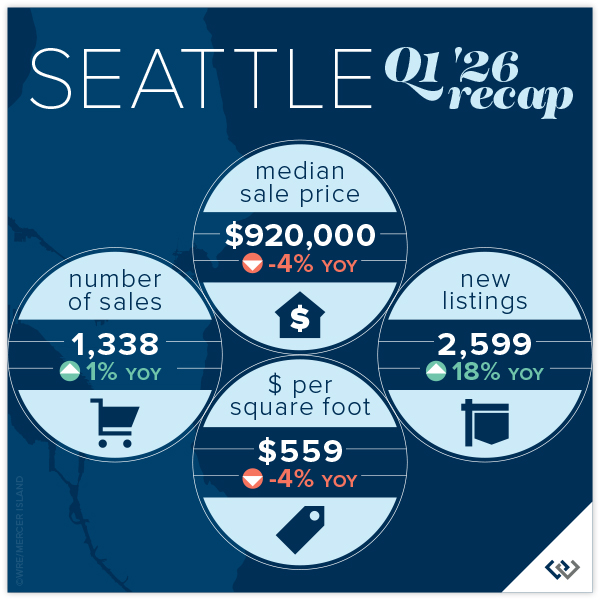
When you look past the overall data, Seattle real estate is firing on all cylinders. Even though the median price is down YOY from $958,000 in 2025 to today’s $920,000 the actual median price point is hot, in city. We’re hearing tales of multiple offers in the $800,000-$1,200,000 price range from all corners of the core Seattle neighborhoods. 67% of homes sold for at or above list price, those that sold above sold for 104% (median) over list! The entire market average list to sales price is 101%, which bodes well for gains YOY in Q2.
West Seattle and Madison Park seem to be carrying the market, the only two neighborhoods to post stable or even a modest gain in price. Maybe not so ironically, Shoreline and Lake Forest Park saw among the highest gain in overall sales volume but also the biggest losses in median price at 10%. Shoppers are savvy and know when they’ve found a deal.
While our market is facing existential pressure from things like rising interest rates, war, and talks of recession; the city hasn’t looked this beautiful in years as officials prepare for World Cup festivities in a few months. There is always a bright side, and homebuyers appear to be seeing the silver lining as they consider their long-term investment plans. If you’ve thought about selling your home in 2026, we think this could be a great year: sales are happening, 55% within the first 10 days.
Click here for the full report and neighborhood-by-neighborhood statistics!

EASTSIDE
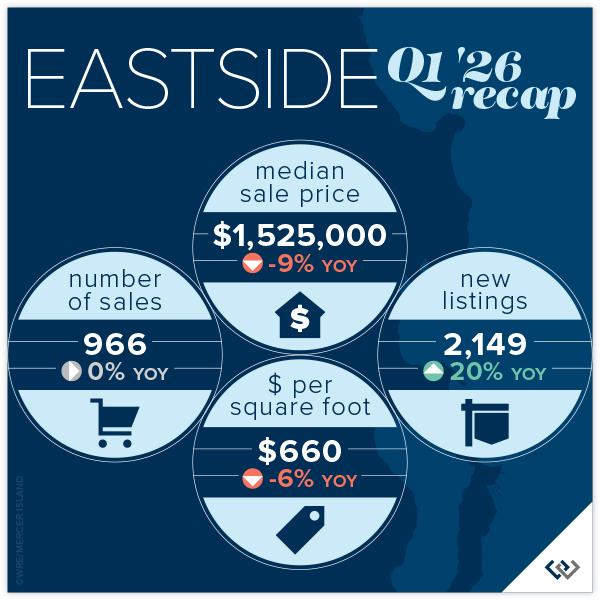
While median prices across the Eastside fell from $1,678,000 in Q1 2025 to $1,520,000, this quarter there are still bright spots. Namely, West Bellevue whose median price jumped 23% YOY. Though while the total number of sales were up in nearly every Eastside city, West Bellevue’s 36% dip drug the market down to report flat total sales: 966 at the end of Q1 2026 compared to 969 in the same period last year.
Mercer Island reported a region-wide high gain in average price per square foot at 14%, and West Bellevue was not far behind at 2%. All other neighborhoods had dips, topped by Redmond which fell 10%.
New listings rose 20% YOY, and this could mean many things but we think the two most likely are: home sellers got a head start in 2026 (we predict fewer new listings in Q2 than last year when new inventory nearly doubled from one quarter to the next) OR everyone else is as bullish about the market as we are. List to sales price ratios are at 99% on average and 51% of homes sold in the first 10 days. If you find the right home, don’t be afraid to jump.
Click here for the full report and neighborhood-by-neighborhood statistics!

MERCER ISLAND
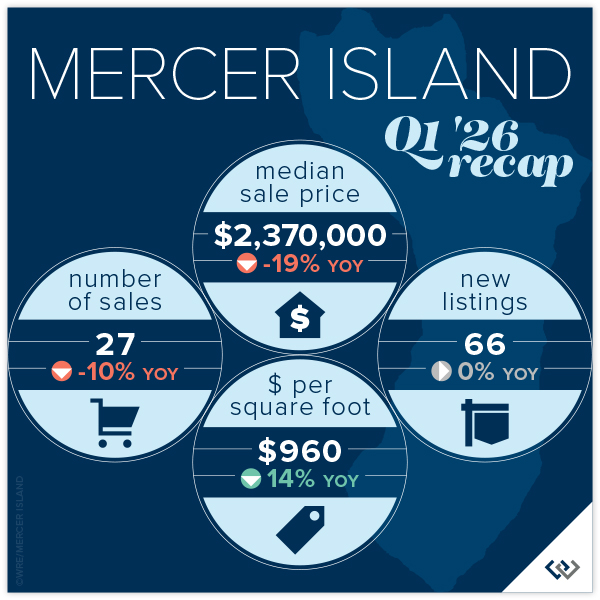
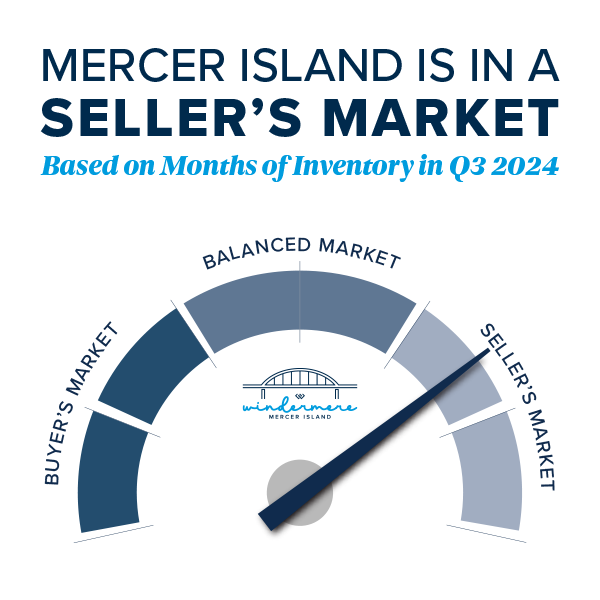
Island real estate seems to be off to a slow start in 2026 with median prices slipping YOY from $2,937,000 in 2025 to $2,370,000 in 2026. This is likely due to a spike in the months of inventory: 4.7 up from 2.9 last Q1. The months of inventory is a barometer for which way prices trend. High inventory = falling prices, supply/demand. That said, 60% of all homes sold for at or above list price and 63% sold in the first 10 days. Both of these numbers are indicators that homeowners are pricing to sell.
The condo market appears to be healthy this spring. Even though there are only 8 total sales that number is up a whopping 60% YOY. Median price is down 33%, but this is a rounding error with only 8 data points this year and 5 last year. A better indicator of market health is a 2.2 months supply of inventory, which is outpacing pretty much any segment of the market!
While our market is facing existential pressure from things like rising interest rates, war, and talks of recession; Mercer Island is now the “Bridge” in a whole new way with light rail open from Seattle to the Eastside. It will be interesting to see how this fun change affects the market as a whole.
Click here for the full report and neighborhood-by-neighborhood statistics!
CONDOS – SEATTLE & EASTSIDE
Seattle condo sales are up 8% over Q4 2025, an incredible seasonal boost. Though, the median price is down 6% YOY to $596,000. 25% of listed condos sold in the first 10 days and 48% of all condos sold for at or above list price. This tells us that agents and homeowners are tuned in to what a homebuyer in today’s market expects.
On the Eastside it’s a very similar story. Inventory is at 5.1 months. Meaning: at the current pace of sales, if no new listings came on the market, it would take nearly half a year to sell through the current inventory. That’s the highest since before 2020, the six year low was Q4 of 2021. Prices seem to reflect this, with an 11% dip in median home price down to $655,000 from Q1 2025: $740,000.
If you’ve thought about selling your condo in 2026, prepare for a highly saturated market where you’ll need to whip your unit into tip-top shape and price competitively to attract buyers. Inventory is up a combined 5%, while sales are down 21%. This is a big gap that will definitely create downward pressure on pricing if the gap between demand and supply widens. If you have the luxury to wait and watch, that might be your best option. If you’ve thought about buying, this is an excellent year to consider your options. Just remember, if you find the right nest and it hasn’t been on the market long: jump in! The good ones don’t last.
Check out area-by-area details in the full condo report.

WATERFRONT
Seattle and the Eastside both had fewer waterfront sales this quarter than we saw in Q1 of 2025, whereas Lake Sammamish posted the same number of sales and Mercer Island saw a boost. The vast majority of homes sold at or below their listed prices with the exception of one mid-century Magnolia home on 75 feet of waterfront that garnered over $300k above and beyond its original asking price.
The highest sale was in Hunts Point at $17+ million for a stunningly reimagined English Tudor on 3/4-acre with extensive waterfront. The most modest sale was in Rainier Beach: an original 1980 home on 50 feet of waterfront that went for $1,640,000.
This brief overview of the entire Seattle-Eastside private waterfront market, including Mercer Island and Lake Sammamish, illustrates the trends occurring in our region over time. This data is interesting and insightful but cannot replace an in-depth waterfront analysis with your trusted professional.
View the full waterfront report


Find a Home | Sell Your Home | Property Research
Neighborhoods | Market Reports | Our Team
We earn the trust and loyalty of our brokers and clients by doing real estate exceptionally well. The leader in our market, we deliver client-focused service in an authentic, collaborative, and transparent manner and with the unmatched knowledge and expertise that comes from decades of experience.
2737 77th Ave SE, Mercer Island, WA 98040 | (206) 232-0446
mercerisland@windermere.com
© Copyright 2026, Windermere Real Estate/Mercer Island. Information and statistics derived from Northwest Multiple Listing Service and Trendgraphix, and deemed accurate but not guaranteed.
Seattle report cover photo courtesy of The Sirianni Group; and Andrew Webb, Clarity NW Photography.
Eastside report cover photo courtesy of Tori Franzen; and Michael Tilzer Photography.
Mercer Island report cover photo courtesy of Julie Wilson; and Chris Neir, Clarity NW Photography.
Condo report cover photo courtesy of Marianne Parks; and Christopher Cooper, Clarity NW Photography.
How’s the Market? Annual Review of Seattle Area Real Estate

Happy New Year! Whew, we made it! With 2024 now in the books, we’re looking back fondly on a real estate market that showed positive signs of growth in virtually every sector. Median sales prices posted strong double-digit gains on the Eastside along with a healthy 8% rise in Seattle. Listings also rose, easing the strain for buyers grappling with our housing shortage.
If you’ve waited long enough and 2025 is the year for you to make a move, we recommend front loading that decision. Pent up demand (both sellers waiting to sell and buyers waiting to buy) should give us a spring full of blossoming and beautiful inventory. There is less volatility in interest rates than there has been in recent months, you’ll see that the average rate has been rock steady around 6.75% in 2023 and 2024. Overall, this is a great time to buy or sell and I know your real estate professional is excited to help you!
Click or scroll down to find your area report:
Seattle | Eastside | Mercer Island | Condos | Waterfront
SEATTLE
From a statistical/real estate perspective, the numbers don’t really reflect the overall vibe of the year. In a good way! It’s all positive news: prices are up, listings are up, and market time is down. The City of Seattle is in full recovery mode. Homeowners are awaiting the new density plan and eager to learn what the city has in store for the core neighborhoods around transit. It’s an exciting time. Median sold price city-wide reached a record $945,000 (modest, as that is $5000 above the previous record set in 2022) and homes sold for an average 104% of list price when they attracted a sale in the first 10 days (58% of the total sales).
Lake Forest Park and Madison Park saw the greatest price gains at 11% and 12% respectively. North Seattle was over all the “strongest” with 66% of homes selling in the first 10 days and 70% of homes selling for at or above list price. There was a modest gain in new listings across the board at 8769, while still lower than typical. The ten-year average is around 10,500 listings per year. No bad news here with average price per square foot gains of 5% to $564!
 Click here for the full report and neighborhood-by-neighborhood statistics!

EASTSIDE
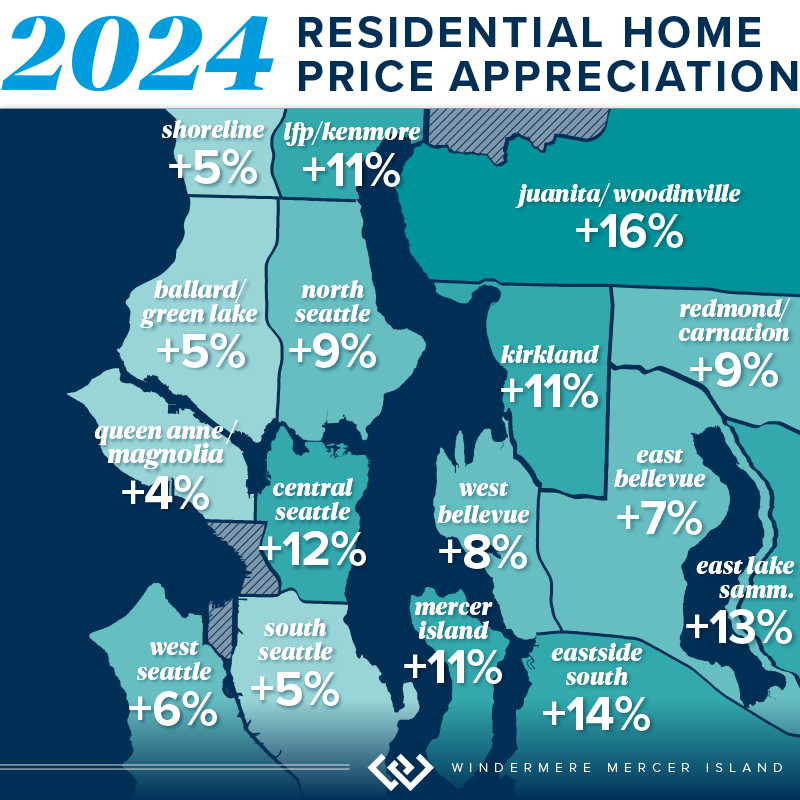
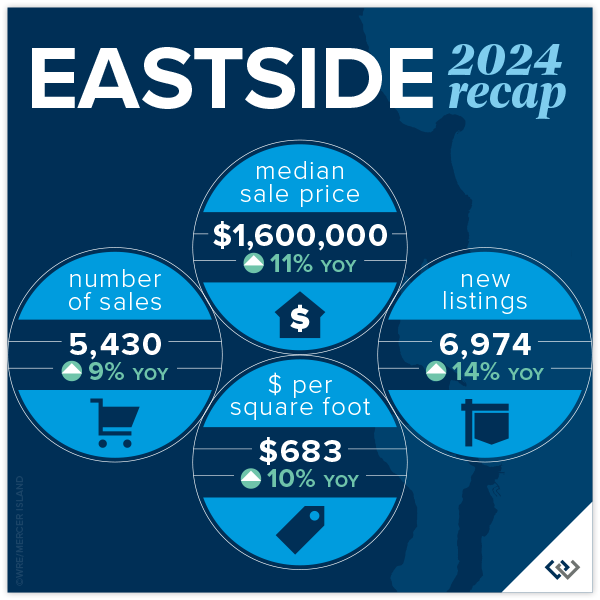
Welcome 2025! We (the real estate community) are feeling hopeful and bullish about what’s to come. So far, the numbers year over year support that. When we reviewed 2023 for the Eastside, the only positive statistic reported was Mercer Island’s 2% rise in the number of home sales. Looking at the 2024 report with that perspective it is ALL good news. New listings are up 14% for the year, while the number of sales are up nearly 10%. This is absorption of inventory to be excited about. Prices are up 11% to a record high of $1,600,000!
Woodinville and the area S of I-90 saw the largest price gains at 16% and 14% respectively, likely enjoying the benefits of buyers ‘pushing out’ because of the pressure of affordability in the core neighborhoods. Kirkland and West Bellevue were among the highest total sales and still a strong showing in price gains at 11% and 8%. Even though Bellevue (E of 405) saw the most modest price gains this was arguably the most popular neighborhood with 74% of homes selling in the first 10 days and 71% selling for at or above asking price!
 Click here for the full report and neighborhood-by-neighborhood statistics!
MERCER ISLAND
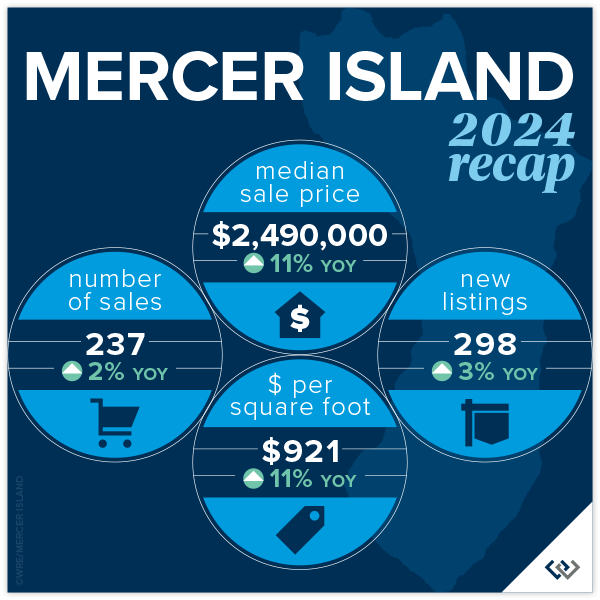
2024 was a solid year for Mercer Island: 11% overall price growth, on average 98% list to sales price ratio, and a respectable 32 cumulative days on market. This was a year of calm and confident decisions made by the entire real estate market. Home buyers and sellers alike. Looking to the neighborhoods there were two that stood out in relation to 2023: The Eastside and The Lakes where total sales had massive growth. 26 homeowners (vs 11 in 2023) moved on the Eastside and in the Lakes there were 4 transactions, a whopping change given that there were no sales reported on the MLS in 2023. The Island has not yet reached the peak prices from 2022, but we’re on our way!
Shifting to the condo market, 2024 was a sleepy year. With 47 new listings and 33 sales (both about 20% lower than in 2023), the average list to sales price ratio of 101% surprised us! Total median price is down YOY by about 8%, but with such little data to draw from this number tends to swing more than most. The overall price swing was from $339,000 for a studio to $1,775,000 for a 2 bedroom luxury unit. 19 of the 33 sales were 2 bedroom units. All in all condos on the island are a necessary market segment that we continue to watch closely as an overall indicator of market health.
 Click here for the full report and neighborhood-by-neighborhood statistics!
CONDOS – SEATTLE & EASTSIDE
In reviewing last years’ report, there was so much RED! This year is a refreshing change with some positive numbers sprinkled in. Even the pockets that remain flat feel like good news, after all, a push is a win! Perspective is everything, in life and in real estate. This year was absolutely a bright spot for condos in the last several months. This was due in large part to external factors: affordability issues in single family, perceived ‘high’ interest rates, continued density issues in the ‘burbs, and major employers recall to office. Urban life in both Seattle and on the Eastside are experiencing a renaissance and we’re here for it!
The headline in Seattle is that prices are UP! Downtown saw an increase of 8% to a median price of $650,000. Though, North Seattle carried the day with an eye popping 18% increase in median price. While price per square foot was flat on average, new listings are up 21% YOY. Sellers are dipping their toes back in the market at higher prices (up 5.3%) and seeing moderate success with total sales down 3% (compared to a 26% drop in 2023). Buyers know they have options and will wait to pick off the low hanging fruit: best perceived value for their dollar.
Meanwhile, on the Eastside: prices are up, listings are up, sales are up. A nice headline, but let’s break it down. New listings rose a whopping 34% year over year (which you may remember saw a 23% dip from 2022). Demand was steady with total sales up 15% YOY; we didn’t quite absorb all of the new inventory but that is to be expected. So, even with a relatively high absorption rate prices rose to a record high median of $695,000. The stars of this price gain are, not surprisingly, Kirkland and West Bellevue at 28% and 24% respectively. We can’t wait to see what 2025 will bring!
Check out area-by-area details the full condo report.

WATERFRONT
The Eastside saw a huge boost in waterfront sales with 50% more sold in 2024 than 2023. Mercer Island and Lake Sammamish posted similar sales gains of 45% and 43% respectively. While Seattle had 2 fewer sales than the year prior, its waterfront homes sold faster than in any other area and fetched higher selling prices as compared to list prices.
The highest waterfront sale was $38,900,000 for an immense 13,590 sq. ft. Medina estate on 117 feet of Lake Washington shoreline. The most modest sale was $1,400,000 for a 1960 Ralph Anderson original on Seattle’s Arroyo Beach.
This brief overview of the entire Seattle-Eastside private waterfront market, including Mercer Island and Lake Sammamish, illustrates the trends occurring in our region over time. This data is interesting and insightful but cannot replace an in-depth waterfront analysis with your trusted professional.

Find a Home | Sell Your Home | Property Research
Neighborhoods | Market Reports | Our Team
We earn the trust and loyalty of our brokers and clients by doing real estate exceptionally well. The leader in our market, we deliver client-focused service in an authentic, collaborative, and transparent manner and with the unmatched knowledge and expertise that comes from decades of experience.
2737 77th Ave SE, Mercer Island, WA 98040 | (206) 232-0446
mercerisland@windermere.com
© Copyright 2025, Windermere Real Estate/Mercer Island. Information and statistics derived from Northwest Multiple Listing Service and Trendgraphix, and deemed accurate but not guaranteed. Seattle cover photo courtesy of Michael Fleming and Clarity Northwest Photography. Mercer Island cover photo courtesy of The Sirianni Group and Clarity Northwest Photography. Condo cover photo courtesy of Luke Bartlett and Matthew Gallant, Clarity Northwest Photography.
How’s the Market? Q3 2024 Review of Seattle Area Real Estate

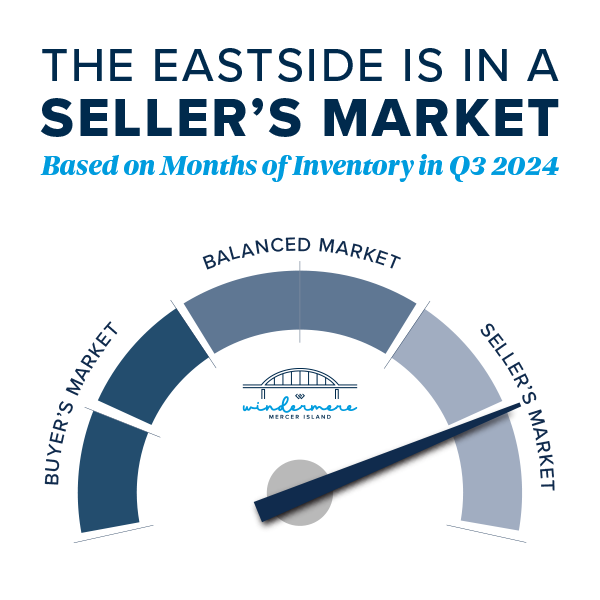
While Q3’s summertime market slowed a bit from the frenetic spring pace of Q2 (we call this the “Summer Slump”), median home values are up across the region compared to this time last year. Most homes still sold at or above their listed prices in the first 10 days on market. However, buyers had more choice with higher inventory levels AND some room to negotiate on price for those homes that stayed on the market past the 10-day mark.
What does this mean for the rest of 2024? We typically see buyer activity decrease as we head into the holidays, and of course, it’s also election season. If you’ve been considering a purchase and are of the mindset that you don’t want to compete, THIS IS YOUR MARKET! For sellers the average days on market in Q3 was 20 for Seattle and 18 for the Eastside. Which means: if your price didn’t attract a buyer in the first two weeks, it’s probably time to re-evaluate. Interest rates are better than they’ve been since mid 2022. Quality inventory is being presented to the market. If you see a great house, be prepared to move quickly. Opportunity Knocks.
Click or scroll down to find your area report:
Seattle | Eastside | Mercer Island | Condos | Waterfront
SEATTLE
Lots of good news in Seattle during our post-summer glow. Prices are up year over year by 5% to $937,000. While we’re still under the peak median of $1,000,000 set in Q2 of 2022 and $970,000 from last quarter, this is so typical for Q3. We’ve seen it every year from Q2 to Q3 going back to 2018 (except in 2020 largely because the real estate market shut down completely in Q2). Buyers had lots of choice, with more inventory to end the quarter than we’ve had since Q3 of 2022. Even with these buyer bright spots we still saw 56% of homes sell in the first 10 days and 34% over the asking price.
Average price per square foot and median price were in positive territory across the board this quarter in all neighborhoods. Richmond Beach/Shoreline and Madison Park/Capitol Hill both saw larger than typical gains in $/sq.ft. (11%) and median price (10%) respectively. North Seattle appeared to be the “hottest” market around with 64% of homes selling in the first 10 days. Again, really great numbers in Seattle given that Summer Slump was in full effect.

 Click here for the full report and neighborhood-by-neighborhood statistics!

EASTSIDE
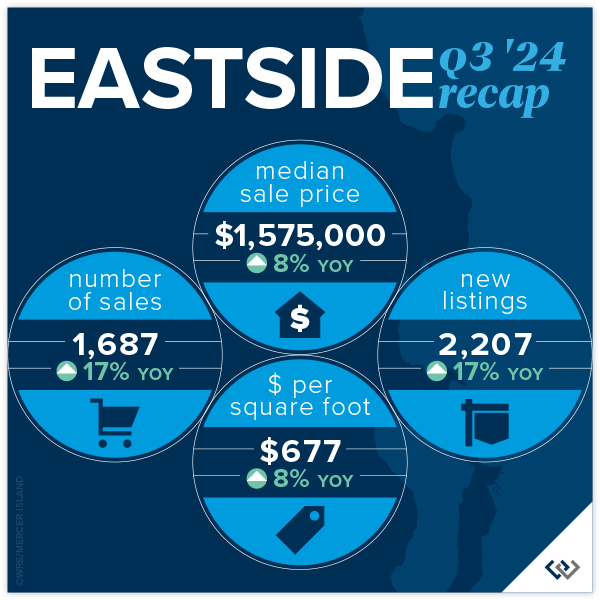
The Eastside continues to be the region’s crown jewel of real estate. Median prices are up again year over year by 8%. Most of us felt what we lovingly call the Summer Slump, and the numbers confirmed this. Prices (median) AND transactions were down 6% overall when compared against Q2 of 2024. That’s a $100,000 dip in median sales price if you missed the spring market. This is absolutely typical for the PNW and Metro King County. Seasonally our peak seasons are spring and post Labor Day/pre-holiday. This year that may be disrupted by election distractions. Time will tell if it’s a market lacking in consumer confidence or simply existential distraction.
The micro markets across the Eastside are fairly homogeneous. Among the 8 neighborhoods that we track, the median price swing was 3-11% but all in a positive direction. Total transaction volume is up 18% signaling that eventually life changes will trump a 2.5% interest rate. While homes were mostly selling in the first 10 days, multiple offers/paying over asking price were not the norm. In fact, the split between at, above, and below was relatively even.
 Click here for the full report and neighborhood-by-neighborhood statistics!

MERCER ISLAND
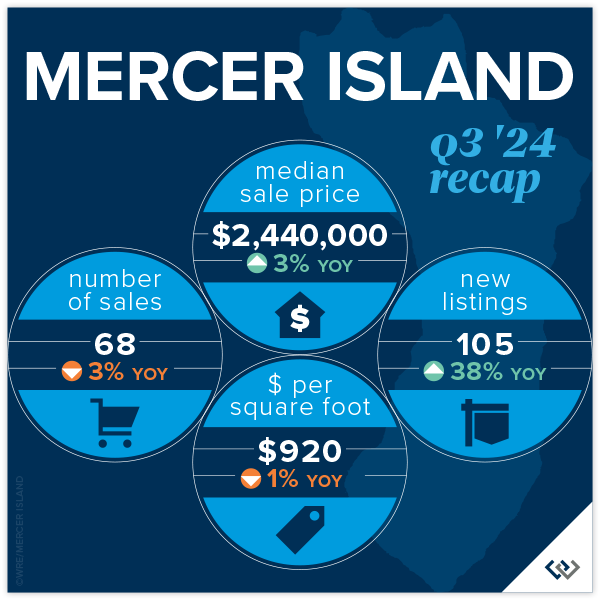
Fall has come for Mercer Island. The summer construction on Island Crest is done, school buses are out en force, and those filtered views that only come out in winter are starting to show. It’s time to look back fondly at the summer real estate market: prices are up YOY by 3% to $2,440,000 to end the quarter. This is likely more about trailing gains from a robust spring than it is about actual gains from Q3, given the indicators. A whopping 40% of homes sold under list price. It took 40% longer than 10 days to sell (not necessarily the same 40%) but only for about a 2% discount. This suggests that seller pricing and buyer motivation are evenly matched. There were 50 active listings at end of quarter, the most since Q2 of 2020 when real estate shut down completely.
Focusing on neighborhoods, The Lakes, Mercerwood, Mercerdale, and Mercer Island Estates saw 100% of homes sell in the first 10 days for an average of 102% of sales price. This goes to show that in any market, despite overall conditions, there will always be “hot homes.” Mid-Island had the most overall activity with 22 of the 68 sales across the Island. These occurred at $865/foot and 16 of the 22 homes sold in the first 10 days for at or above list price.
 Click here for the full report and neighborhood-by-neighborhood statistics!

CONDOS – SEATTLE & EASTSIDE
Once again, we’re rooting for the Seattle condo market as it proves to be the little engine that could! Chugging along toward modest price gains even when the rest of the market seems to be struggling a bit, Seattle condo prices have held steady for the last 6 quarters, with mostly positive change. Eastside condos hit a median price all-time high in Q2 at $709,000. We’re off of that a touch to $690,000 in Q3, to be expected after a beautiful summer. The Eastside ended the quarter with 29% more listings than this time last year and only 13% more sales. Mounting inventory tends to lead to price softening. Overall, nearly 50% of condos sold for at or above their list price!
When you compare the charts in the report, there is admittedly more positive news on the Eastside than in Seattle. Overall, we’re encouraged that despite many neighborhoods experiencing a drop in sales, average price per sq. ft. held flat and median price is up overall. On the Eastside it’s still great news all around for the market, especially in West Bellevue with 26% median sales price gains and total sales up 55%.
Friendly PSA: PLEASE remember that there is a ‘first rung’ of the property ladder. CONDOS create an affordable option to start building wealth at a younger age. It’s an important real estate product that has been overlooked. I am hopeful that enterprising young homeowners return to the condo market in droves this next real estate cycle.
Check out area-by-area details the full condo report.

WATERFRONT
While a bit slower compared to last quarter, waterfront sales remained strong in Q3 with 10 on the Eastside and 8 in Seattle. Lake Sammamish moderated in summer with just 5 sales compared to the crazy 15 we saw in spring, while Mercer Island stayed fairly steady with 4 (compared to 6 in spring). The highest sale was nearly $18 million for an immense Wendell Lovett designed 6,920 sq. ft. home on 125 feet of prime “gold coast” waterfront in Medina. The most modest sale was also on the Eastside—an original 1943 cottage on 53 feet of west-facing waterfront in Kennydale.
This brief overview of the entire Seattle-Eastside private waterfront market, including Mercer Island and Lake Sammamish, illustrates the trends occurring in our region over time. This data is interesting and insightful but cannot replace an in-depth waterfront analysis with your trusted professional.
Find a Home | Sell Your Home | Property Research
Neighborhoods | Market Reports | Our Team
We earn the trust and loyalty of our brokers and clients by doing real estate exceptionally well. The leader in our market, we deliver client-focused service in an authentic, collaborative, and transparent manner and with the unmatched knowledge and expertise that comes from decades of experience.
2737 77th Ave SE, Mercer Island, WA 98040 | (206) 232-0446
mercerisland@windermere.com
© Copyright 2024, Windermere Real Estate/Mercer Island. Information and statistics derived from Northwest Multiple Listing Service and Trendgraphix, and deemed accurate but not guaranteed. Seattle cover photo courtesy of Kathryn Buchanan and Brandon Larson, Clarity Northwest Photography. Mercer Island cover photo courtesy of The Sirianni Group and Clarity Northwest Photography. Condo cover photo courtesy of Julie Wilson and Bobby Erdt, Clarity Northwest Photography. Waterfront cover photo courtesy of Anni Zilz and Andrew Webb, Clarity Northwest Photography.
Property Tax Relief Programs in King County

Updated 2/2025
More than 26,000 low-income seniors and disabled people in King County who qualify for a tax exemption haven’t claimed it…are you or your family member one of them?
If you are homeowner, make $84k or less per year, and are either age 61+, retired due to disability, or 57+ and the surviving spouse/domestic partner of an exemption participant, there is a good chance you qualify. You can even retroactively apply for the exemption for the prior 3 years!
Scroll down for details on this exemption plus 4 other property tax relief programs that King County offers.
In another county? Here is the full list of income thresholds for every county in Washington State, and here is another link to view the programs each county offers.
Senior/Disabled Property Tax Exemption
WHAT IS IT?
A reduction in King County property tax for seniors, people with disabilities, and disabled veterans.
WHO QUALIFIES?
- Seniors age 61+
or
- Those who cannot work due to a disability
or
- Veterans with service-related disabilities (evaluation of at least 80% or receiving compensation from the VA at the 100% rate)
or
- Those who are age 57+ AND a surviving spouse/domestic partner of an exemption participant who was enrolled at the time of their death
YOU MUST…
- Own your home
- Have occupied it as a primary residence at least 6 months out of the year
INCOME LIMIT
- $84,000 maximum annual household income for the previous year in King County (click here for other counties)
WAYS TO APPLY
- Click here to apply online
- Call 206-296-3920
- Ask your local senior center if they help with applications
Senior/Disabled Property Tax Deferral
WHAT IS IT?
The ability for seniors & disabled people to defer unpaid property tax/special assessments, including back taxes for as long as you’ve owned the home. Deferred taxes + any accumulated interest then become a lien on the property until it’s repaid.
WHO QUALIFIES?
- Seniors age 60+
or
- Those who cannot work due to a physical disability
YOU MUST…
- Own your home and have lived in it for more than 9 months in a calendar year
- Meet an equity requirement
INCOME LIMIT
- $88,998 maximum annual household disposable income in King County (click here for other counties)
HOW TO APPLY
- Call 206-263-2338
MORE TAX RELIEF PROGRAMS…
Limited Income Deferral
WHAT IS IT?
The ability to defer the second installment of your property taxes/special assessments (normally due October 31st) if you are a low-income homeowner. The deferred taxes plus interest become a lien on the property until they’re repaid.
YOU MUST…
- Have owned your property for 5 years
- Be living in the home as of January 1st of the application year AND more than 9 months during that year
- Meet an equity retirement
- Have already paid the first half of your taxes (due April 30th)
INCOME LIMIT
- $57,000 maximum annual household income in the previous year (all counties in Washington State)
HOW TO APPLY
Homeowner Improvement Exemption
WHAT IS IT?
Relief from tax increases caused by major additions or remodels.
YOU MUST…
- Own a detached single family dwelling (including mobile homes)
- File your claim for exemption with the assessor BEFORE construction is complete
HOW TO APPLY
- Call 206-263-2338
Flood & Storm Damage Property Tax Reduction
WHAT IS IT?
Tax relief for property damaged by something beyond the owner’s control. Eligible properties receive a reduction of assessed value resulting in lower property taxes. In addition, taxpayers can receive an exemption to keep taxes lower for the 3 years after they rebuild.
YOU MUST…
- Have your property on the assessment roll as of January 1st in the year it was damaged
- Have property that was destroyed, OR was in a declared disaster area and reduced in value by more than 20% as a result of the disaster
HOW TO APPLY
- Complete a Destroyed Property Claim Form and file it with King County Dept of Assessments within 3 years of the damaging event
- Call 206-263-2332 with questions
For more information on any of these programs, visit the King County Assessor’s tax relief page. You can also find info for other counties on the WA Dept of Revenue website.
Find a Home | Sell Your Home | Property Research
Neighborhoods | Market Reports | Our Team
We earn the trust and loyalty of our brokers and clients by doing real estate exceptionally well. The leader in our market, we deliver client-focused service in an authentic, collaborative, and transparent manner and with the unmatched knowledge and expertise that comes from decades of experience.
2737 77th Ave SE, Mercer Island, WA 98040 | (206) 232-0446
mercerisland@windermere.com
© Copyright 2023-2025, Windermere Real Estate/Mercer Island.


