Facebook
 X
 Pinterest
 Copy Link
How’s the Market? Q3 2026 Review of Seattle Area Real Estate

Summer is seasonally slumpy in the Greater Seattle area. There are so many distractions! Looking back at our Summer Slump this year, however, we believe it could be a sign of things to come. With new listings up year over year, sales cooling, and more than 3 months worth of listing inventory (4+ months on the Eastside), we may be nearing the first true buyer’s market we’ve seen since September of 2011.
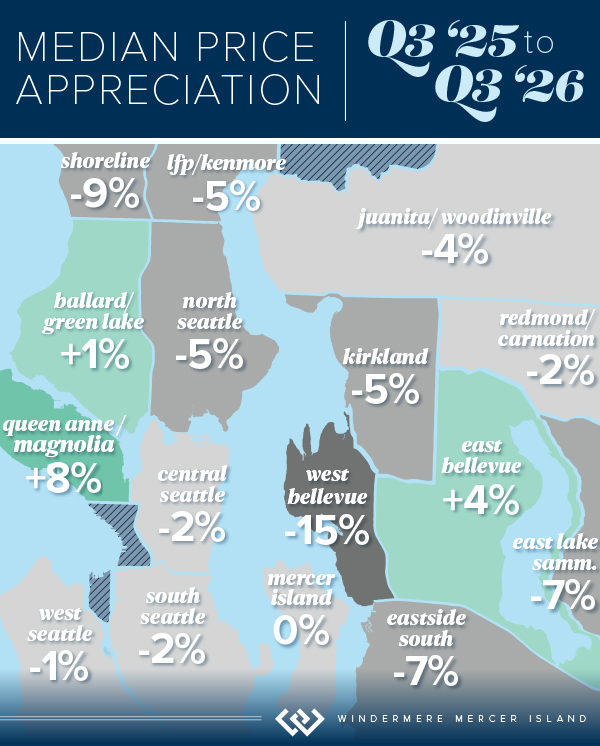
Prices dipped or remained flat in most areas, although a few neighborhoods saw a year-over-year boost. About half of Seattle homes and 1/3 of Eastside homes sold within their first 10 days on the market. While exceptionally desirable properties still drew bidding wars, the vast majority of homes sold at or below their listed prices.
The stats are sobering, but our situation is so much different now than in 2011. The main difference: homeowners have equity to tap into in most cases. Nationally, over 41% of homeowners have more than 50% equity in their homes. In 2011 we were plagued by short sales and foreclosures, which is simply not the case today. While interest rates have hit their highest levels since 2000, it is still a great time to move, especially if you’re considering a trade up. Remember, inventory hasn’t been this plentiful in 15 (fifteen!) years. If you’re feeling like you’ve outgrown your house or your house has outgrown you, a skilled agent can help you with an analysis to decide if it’s your time to take advantage of this buyer’s market.
Click or scroll down to find your area report:
Seattle | Eastside | Mercer Island | Condos | Waterfront
SEATTLE
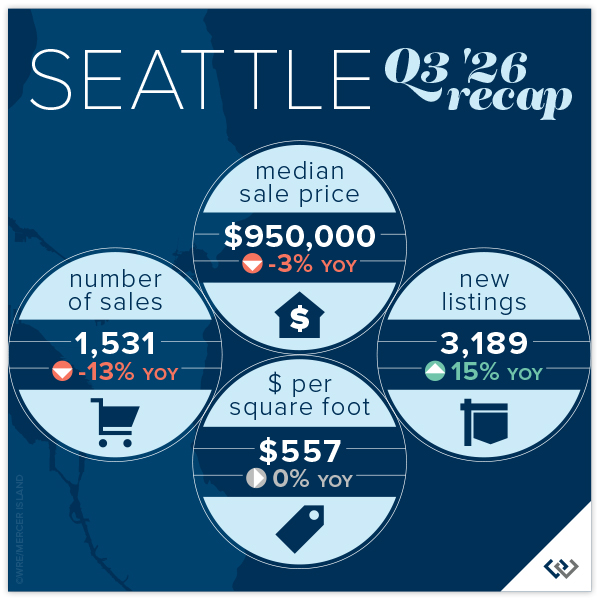
The core Seattle neighborhoods seem to still be attracting attention (and gains); Queen Anne/Magnolia saw a 9% dip in volume but an 8% gain in median price, from $1,299,000 to $1,399,000. Shoreline saw a 9% dip in price while sales volume stayed steady at -2%.
All in all, residential real estate in the city remained relatively flat, seeing a 3% drop from Q3 2025. It will be interesting to see what the quarters to come will hold. In true Seattle fashion, the booms aren’t as big and the dips are easier to fare.
Click here for the full report and neighborhood-by-neighborhood statistics!

EASTSIDE
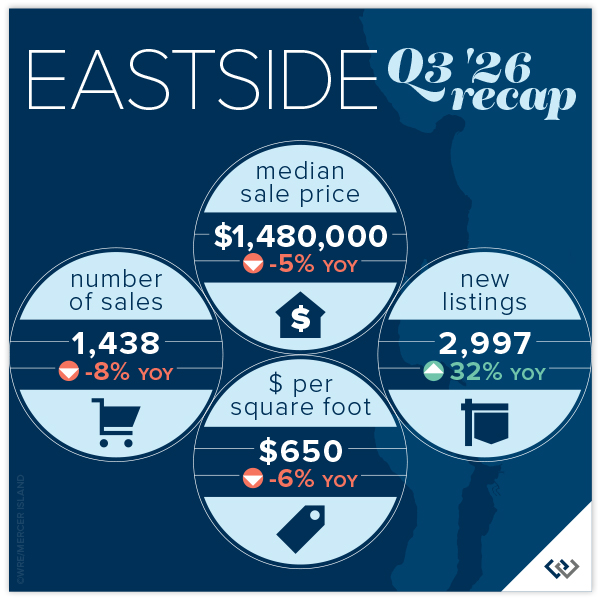
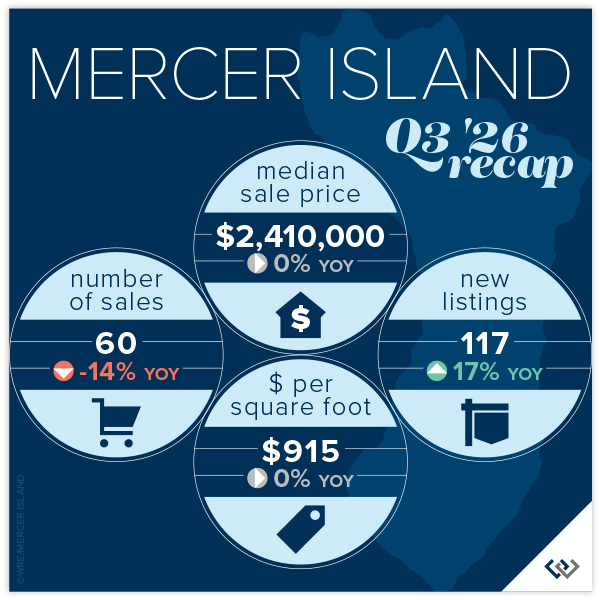
It is clear that the ultra-high end has had the largest correction; West Bellevue is down 15% year over year and 22% since the peak in Q4 2025. Mercer Island is flat year over year, but the disparity between median active price ($3.3m) and median sold price ($2.4m) tells us that there is a glut of high-end inventory.
The bright spot for sellers is East Bellevue, posting a 4% year-over-year gain at a median price of $1,610,000. With all of this, 36% of homes still sold above the list price, a sure sign that some home sellers are taking their savvy agents’ advice on positioning.
Click here for the full report and neighborhood-by-neighborhood statistics!

MERCER ISLAND
If you can “nail” price and presentation, you have a 55% chance of selling in the first 10 days on the market and being like the 43% of homes that sold for at or above list price during Q3. If you’re on First Hill, in Mercer Island Estates or the Lakes, odds are you’re in this group; 100% of those homes sold in the first 10 days. Location, Location, Location! Though, if you don’t get it right the first time (like 57% of the market) you could be facing a pool of buyers who expect a larger discount than we’ve seen in recent years.
New listings are up year over year on the Island by 17%, making this a good time to trade up if you’ve been considering an upgrade. There are 18 active waterfront properties and with only 3 sales in Q3 (typically waterfront season) that translates to 18 months of waterfront inventory. I can’t remember a better time to snag a piece of coastline!
Click here for the full report and neighborhood-by-neighborhood statistics!

CONDOS – SEATTLE & EASTSIDE
Year-over-year Seattle condo prices slipped 2.7%, which is the slimmest margin we’ve seen in a while. There is a large disparity across the region with Lake Forest Park seeing a 27% gain in median price compared to an 18% decline for Downtown condos. The velocity doesn’t seem to be affected with 22% of listings selling in the first 10 days and an average of 39% of all homes selling above asking price. Our home shoppers are savvy and willing to jump for something special.
On the Eastside there is slightly more volatility. Sales are down a total of 26%, meaning only 409 lucky home sellers were able to hand over their keys in Q3. When you consider that there were 1,109 new listings, that number is tough to swallow. Those home shoppers got great deals as the median price was down 12% year-over-year. Nowhere was this more true than on Mercer Island with a 23% dip in median price (though with only 14 of those 409 sales, that dip may just be a temporary product shift).
The stats are sobering, but somewhat encouraging, especially if you are thinking about stepping onto the first rung of the property ladder. Condos are an incredible value and prices have to be hitting the bottom. While some homeowners have equity, we’re often seeing prices go back to 2017 and 2018 levels. There are 25 condos in King County listed as short sales. The bargains are out there just waiting to be snapped up!
Check out area-by-area details in the full condo report.

WATERFRONT
Seattle and Lake Sammamish led the pack in Q3 with 12 waterfront home sales each. Both beat last year’s numbers, with Seattle up from 10 and Lake Sammamish up from 9 in Q3 2025. On the other hand, the Eastside slowed to 7 sales from 11 a year ago. Mercer Island also saw a slowdown with just 3 waterfront sales compared to 6 in Q3 of last year.
In spite of its lower volume of sales, Mercer Island can still boast the highest price: $28 million for a custom estate clocking in at nearly 10,000 sq. ft. with over an acre of grounds and 109 feet of prime low-bank waterfront. At the opposite end, a 1929 fixer on the south end of Lake Sammamish sold off-market at a steal (and below its assessed value) for just $1,000,000.
This brief overview of the entire Seattle-Eastside private waterfront market, including Mercer Island and Lake Sammamish, illustrates the trends occurring in our region over time. This data is interesting and insightful but cannot replace an in-depth waterfront analysis with your trusted professional.
View the full waterfront report


Find a Home | Sell Your Home | Property Research
Neighborhoods | Market Reports | Our Team
We earn the trust and loyalty of our brokers and clients by doing real estate exceptionally well. The leader in our market, we deliver client-focused service in an authentic, collaborative, and transparent manner and with the unmatched knowledge and expertise that comes from decades of experience.
2737 77th Ave SE, Mercer Island, WA 98040 | (206) 232-0446
mercerisland@windermere.com
© Copyright 2026, Windermere Real Estate/Mercer Island. Information and statistics derived from Northwest Multiple Listing Service and Trendgraphix, and deemed accurate but not guaranteed.
Seattle report cover photo courtesy of Anni Zilz; and Andrew Webb, Clarity NW Photography.
Eastside report cover photo courtesy of Mike Ferreri; and Kell Morrissey, Clarity NW Photography.
Mercer Island report cover photo courtesy of Laurie Givan; and Matthew Gallant, Clarity NW Photography.
Condo report cover photo courtesy of Luke Bartlett; and Matthew Gallant, Clarity NW Photography.
Housing Forecast: 6 Predictions for 2026

The following is a summary of Windermere Principal Economist Jeff Tucker’s six predictions for the U.S. housing market and economy in 2026. He goes into more detail about his predictions in the video below.
1. Existing Home Sales Will Pick Up (Barely)
Home sales have hovered near generational lows for three years. While a sharp rebound is unlikely, conditions point to a modest uptick in 2026. Inventory levels are higher than they’ve been since 2019, and mortgage rates are lower than they’ve been since 2022. Together, those factors should lift existing home sales—but not by much.
2. Home Prices Will Be Roughly Flat
Home prices are likely to remain flat in 2026, largely due to higher inventory putting downward pressure on values. The Case-Shiller Home Price Index showed small declines last summer, though that trend faded by fall. Sellers have been highly responsive to market shifts, often de-listing when offers fall short or holding off on listing altogether. That restraint has kept prices from falling further despite growing supply
3. Inventory Will Climb to Pre-Pandemic Levels
The number of homes for sale will likely return to pre-pandemic levels in 2026, possibly as early as spring. Inventory rose sharply in 2025, and a “shadow supply” of homes—those whose owners are waiting for better conditions—remains in the wings. Many “discretionary sellers” will continue testing the market, holding out for the right price. That behavior should extend average time on market and boost total listings, giving buyers more options and negotiating power.
4. The Homeownership Rate Will Decline
At current prices and interest rates, homeownership remains out of reach for many middle-class Americans who would have bought in different conditions. Slower rent growth has also reduced urgency among would-be buyers, encouraging them to stay put. More renters are opting for single-family homes to enjoy the space and lifestyle of ownership without a mortgage, a shift that will help push the overall homeownership rate slightly lower.
5. Mortgage Rates Will Decline Slightly
Mortgage rates should remain below 6.25% for most of 2026 and could briefly dip under 6%. The Fed’s rate cuts and slower growth have brought 10-year Treasury yields near 4%, while the spread between Treasuries and mortgage rates has narrowed toward its normal range of 2% or less. That trend is expected to continue as refinance risk on mortgage-backed securities gradually fades, but much of the improvement is already reflected in current rates, so significant declines are unlikely.
6. We Will Avoid a Recession in 2026
The U.S. economy weathered several shocks in 2025 but avoided a downturn. Payroll gains have slowed, though more due to shrinking labor supply than weak demand, and unemployment claims have remained stable. After early trade policy turbulence, corporate earnings rebounded strongly, and tariff concerns have faded as court challenges and new trade deals rolled back some of the costliest restrictions.
This article originally appeared on the Windermere blog December 2, 2025.
Find a Home | Sell Your Home | Property Research
Neighborhoods | Market Reports | Our Team
We earn the trust and loyalty of our brokers and clients by doing real estate exceptionally well. The leader in our market, we deliver client-focused service in an authentic, collaborative, and transparent manner and with the unmatched knowledge and expertise that comes from decades of experience.
2737 77th Ave SE, Mercer Island, WA 98040 | (206) 232-0446
mercerisland@windermere.com
© Copyright 2025, Windermere Real Estate/Mercer Island.
How’s the Market? Annual Review of Seattle Area Real Estate

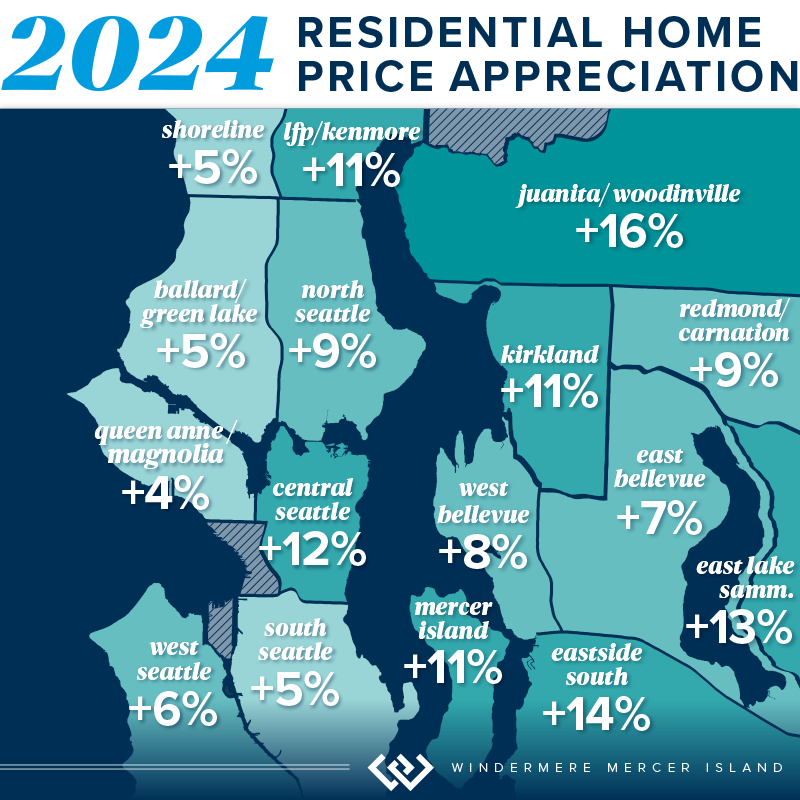
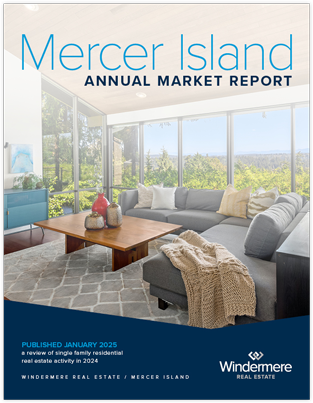
Happy New Year! Whew, we made it! With 2024 now in the books, we’re looking back fondly on a real estate market that showed positive signs of growth in virtually every sector. Median sales prices posted strong double-digit gains on the Eastside along with a healthy 8% rise in Seattle. Listings also rose, easing the strain for buyers grappling with our housing shortage.
If you’ve waited long enough and 2025 is the year for you to make a move, we recommend front loading that decision. Pent up demand (both sellers waiting to sell and buyers waiting to buy) should give us a spring full of blossoming and beautiful inventory. There is less volatility in interest rates than there has been in recent months, you’ll see that the average rate has been rock steady around 6.75% in 2023 and 2024. Overall, this is a great time to buy or sell and I know your real estate professional is excited to help you!
Click or scroll down to find your area report:
Seattle | Eastside | Mercer Island | Condos | Waterfront
SEATTLE
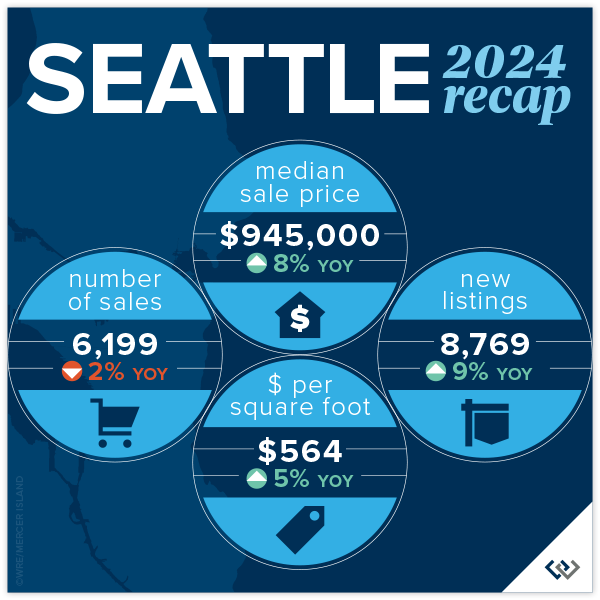
From a statistical/real estate perspective, the numbers don’t really reflect the overall vibe of the year. In a good way! It’s all positive news: prices are up, listings are up, and market time is down. The City of Seattle is in full recovery mode. Homeowners are awaiting the new density plan and eager to learn what the city has in store for the core neighborhoods around transit. It’s an exciting time. Median sold price city-wide reached a record $945,000 (modest, as that is $5000 above the previous record set in 2022) and homes sold for an average 104% of list price when they attracted a sale in the first 10 days (58% of the total sales).
Lake Forest Park and Madison Park saw the greatest price gains at 11% and 12% respectively. North Seattle was over all the “strongest” with 66% of homes selling in the first 10 days and 70% of homes selling for at or above list price. There was a modest gain in new listings across the board at 8769, while still lower than typical. The ten-year average is around 10,500 listings per year. No bad news here with average price per square foot gains of 5% to $564!
 Click here for the full report and neighborhood-by-neighborhood statistics!

EASTSIDE
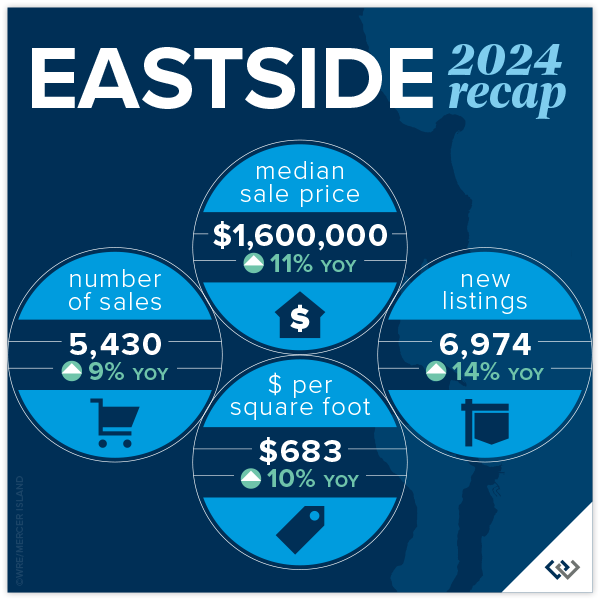
Welcome 2025! We (the real estate community) are feeling hopeful and bullish about what’s to come. So far, the numbers year over year support that. When we reviewed 2023 for the Eastside, the only positive statistic reported was Mercer Island’s 2% rise in the number of home sales. Looking at the 2024 report with that perspective it is ALL good news. New listings are up 14% for the year, while the number of sales are up nearly 10%. This is absorption of inventory to be excited about. Prices are up 11% to a record high of $1,600,000!
Woodinville and the area S of I-90 saw the largest price gains at 16% and 14% respectively, likely enjoying the benefits of buyers ‘pushing out’ because of the pressure of affordability in the core neighborhoods. Kirkland and West Bellevue were among the highest total sales and still a strong showing in price gains at 11% and 8%. Even though Bellevue (E of 405) saw the most modest price gains this was arguably the most popular neighborhood with 74% of homes selling in the first 10 days and 71% selling for at or above asking price!
 Click here for the full report and neighborhood-by-neighborhood statistics!

MERCER ISLAND
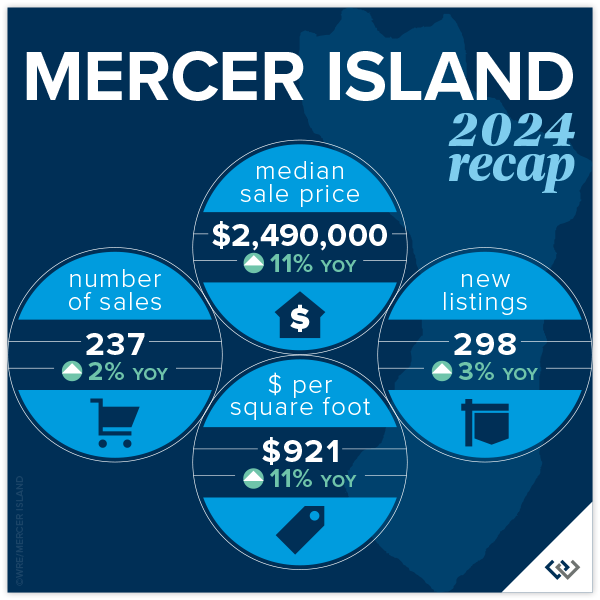
2024 was a solid year for Mercer Island: 11% overall price growth, on average 98% list to sales price ratio, and a respectable 32 cumulative days on market. This was a year of calm and confident decisions made by the entire real estate market. Home buyers and sellers alike. Looking to the neighborhoods there were two that stood out in relation to 2023: The Eastside and The Lakes where total sales had massive growth. 26 homeowners (vs 11 in 2023) moved on the Eastside and in the Lakes there were 4 transactions, a whopping change given that there were no sales reported on the MLS in 2023. The Island has not yet reached the peak prices from 2022, but we’re on our way!
Shifting to the condo market, 2024 was a sleepy year. With 47 new listings and 33 sales (both about 20% lower than in 2023), the average list to sales price ratio of 101% surprised us! Total median price is down YOY by about 8%, but with such little data to draw from this number tends to swing more than most. The overall price swing was from $339,000 for a studio to $1,775,000 for a 2 bedroom luxury unit. 19 of the 33 sales were 2 bedroom units. All in all condos on the island are a necessary market segment that we continue to watch closely as an overall indicator of market health.
 Click here for the full report and neighborhood-by-neighborhood statistics!
CONDOS – SEATTLE & EASTSIDE
In reviewing last years’ report, there was so much RED! This year is a refreshing change with some positive numbers sprinkled in. Even the pockets that remain flat feel like good news, after all, a push is a win! Perspective is everything, in life and in real estate. This year was absolutely a bright spot for condos in the last several months. This was due in large part to external factors: affordability issues in single family, perceived ‘high’ interest rates, continued density issues in the ‘burbs, and major employers recall to office. Urban life in both Seattle and on the Eastside are experiencing a renaissance and we’re here for it!
The headline in Seattle is that prices are UP! Downtown saw an increase of 8% to a median price of $650,000. Though, North Seattle carried the day with an eye popping 18% increase in median price. While price per square foot was flat on average, new listings are up 21% YOY. Sellers are dipping their toes back in the market at higher prices (up 5.3%) and seeing moderate success with total sales down 3% (compared to a 26% drop in 2023). Buyers know they have options and will wait to pick off the low hanging fruit: best perceived value for their dollar.
Meanwhile, on the Eastside: prices are up, listings are up, sales are up. A nice headline, but let’s break it down. New listings rose a whopping 34% year over year (which you may remember saw a 23% dip from 2022). Demand was steady with total sales up 15% YOY; we didn’t quite absorb all of the new inventory but that is to be expected. So, even with a relatively high absorption rate prices rose to a record high median of $695,000. The stars of this price gain are, not surprisingly, Kirkland and West Bellevue at 28% and 24% respectively. We can’t wait to see what 2025 will bring!
Check out area-by-area details the full condo report.

WATERFRONT
The Eastside saw a huge boost in waterfront sales with 50% more sold in 2024 than 2023. Mercer Island and Lake Sammamish posted similar sales gains of 45% and 43% respectively. While Seattle had 2 fewer sales than the year prior, its waterfront homes sold faster than in any other area and fetched higher selling prices as compared to list prices.
The highest waterfront sale was $38,900,000 for an immense 13,590 sq. ft. Medina estate on 117 feet of Lake Washington shoreline. The most modest sale was $1,400,000 for a 1960 Ralph Anderson original on Seattle’s Arroyo Beach.
This brief overview of the entire Seattle-Eastside private waterfront market, including Mercer Island and Lake Sammamish, illustrates the trends occurring in our region over time. This data is interesting and insightful but cannot replace an in-depth waterfront analysis with your trusted professional.

Find a Home | Sell Your Home | Property Research
Neighborhoods | Market Reports | Our Team
We earn the trust and loyalty of our brokers and clients by doing real estate exceptionally well. The leader in our market, we deliver client-focused service in an authentic, collaborative, and transparent manner and with the unmatched knowledge and expertise that comes from decades of experience.
2737 77th Ave SE, Mercer Island, WA 98040 | (206) 232-0446
mercerisland@windermere.com
© Copyright 2025, Windermere Real Estate/Mercer Island. Information and statistics derived from Northwest Multiple Listing Service and Trendgraphix, and deemed accurate but not guaranteed. Seattle cover photo courtesy of Michael Fleming and Clarity Northwest Photography. Mercer Island cover photo courtesy of The Sirianni Group and Clarity Northwest Photography. Condo cover photo courtesy of Luke Bartlett and Matthew Gallant, Clarity Northwest Photography.
How’s the Market? Q3 2024 Review of Seattle Area Real Estate

While Q3’s summertime market slowed a bit from the frenetic spring pace of Q2 (we call this the “Summer Slump”), median home values are up across the region compared to this time last year. Most homes still sold at or above their listed prices in the first 10 days on market. However, buyers had more choice with higher inventory levels AND some room to negotiate on price for those homes that stayed on the market past the 10-day mark.
What does this mean for the rest of 2024? We typically see buyer activity decrease as we head into the holidays, and of course, it’s also election season. If you’ve been considering a purchase and are of the mindset that you don’t want to compete, THIS IS YOUR MARKET! For sellers the average days on market in Q3 was 20 for Seattle and 18 for the Eastside. Which means: if your price didn’t attract a buyer in the first two weeks, it’s probably time to re-evaluate. Interest rates are better than they’ve been since mid 2022. Quality inventory is being presented to the market. If you see a great house, be prepared to move quickly. Opportunity Knocks.
Click or scroll down to find your area report:
Seattle | Eastside | Mercer Island | Condos | Waterfront
SEATTLE
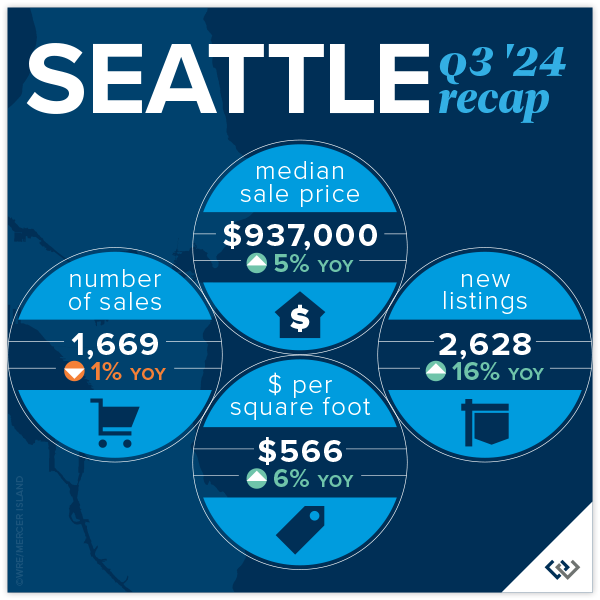
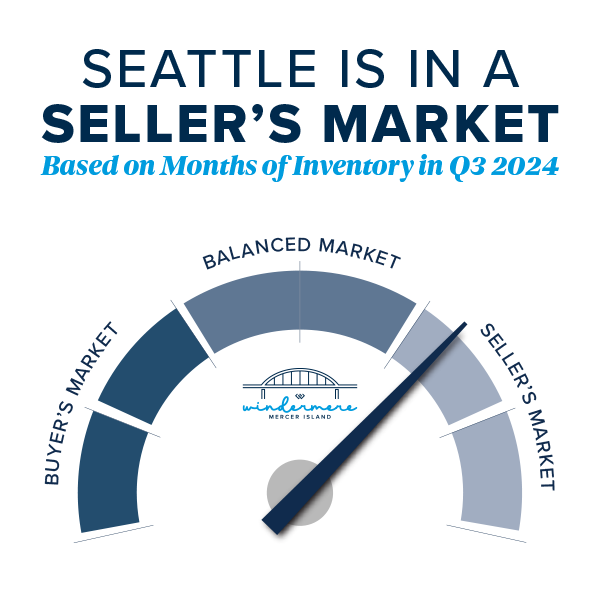
Lots of good news in Seattle during our post-summer glow. Prices are up year over year by 5% to $937,000. While we’re still under the peak median of $1,000,000 set in Q2 of 2022 and $970,000 from last quarter, this is so typical for Q3. We’ve seen it every year from Q2 to Q3 going back to 2018 (except in 2020 largely because the real estate market shut down completely in Q2). Buyers had lots of choice, with more inventory to end the quarter than we’ve had since Q3 of 2022. Even with these buyer bright spots we still saw 56% of homes sell in the first 10 days and 34% over the asking price.
Average price per square foot and median price were in positive territory across the board this quarter in all neighborhoods. Richmond Beach/Shoreline and Madison Park/Capitol Hill both saw larger than typical gains in $/sq.ft. (11%) and median price (10%) respectively. North Seattle appeared to be the “hottest” market around with 64% of homes selling in the first 10 days. Again, really great numbers in Seattle given that Summer Slump was in full effect.
 Click here for the full report and neighborhood-by-neighborhood statistics!

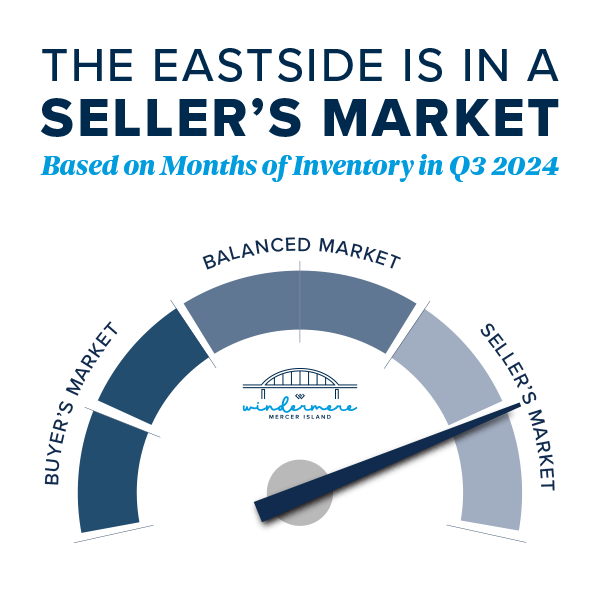
EASTSIDE
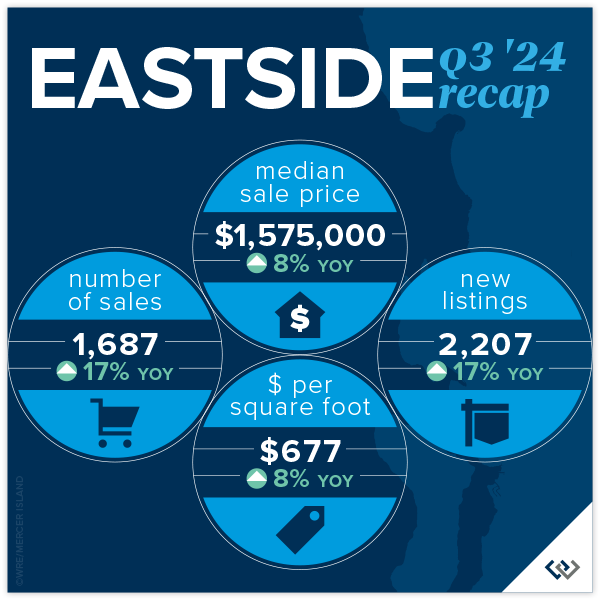
The Eastside continues to be the region’s crown jewel of real estate. Median prices are up again year over year by 8%. Most of us felt what we lovingly call the Summer Slump, and the numbers confirmed this. Prices (median) AND transactions were down 6% overall when compared against Q2 of 2024. That’s a $100,000 dip in median sales price if you missed the spring market. This is absolutely typical for the PNW and Metro King County. Seasonally our peak seasons are spring and post Labor Day/pre-holiday. This year that may be disrupted by election distractions. Time will tell if it’s a market lacking in consumer confidence or simply existential distraction.
The micro markets across the Eastside are fairly homogeneous. Among the 8 neighborhoods that we track, the median price swing was 3-11% but all in a positive direction. Total transaction volume is up 18% signaling that eventually life changes will trump a 2.5% interest rate. While homes were mostly selling in the first 10 days, multiple offers/paying over asking price were not the norm. In fact, the split between at, above, and below was relatively even.
 Click here for the full report and neighborhood-by-neighborhood statistics!

MERCER ISLAND
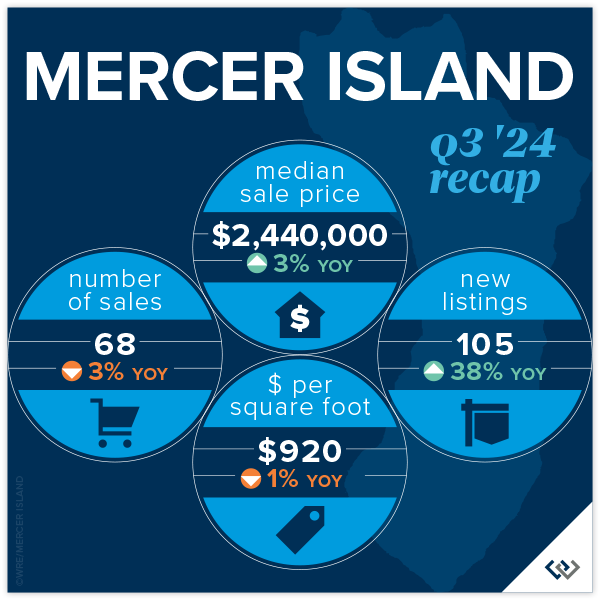
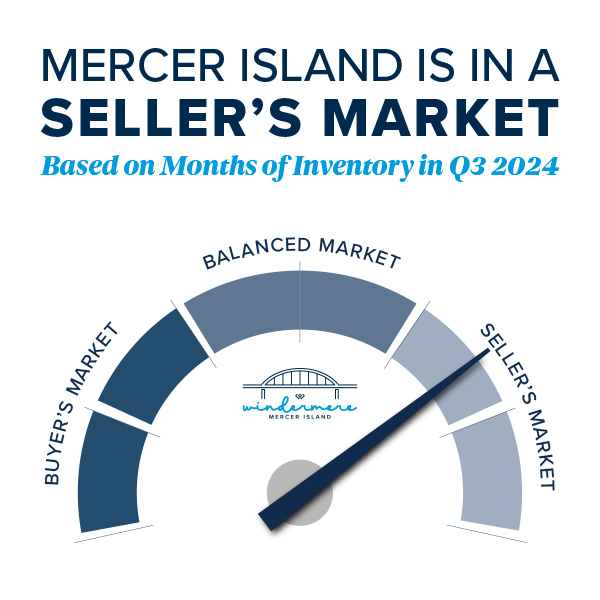
Fall has come for Mercer Island. The summer construction on Island Crest is done, school buses are out en force, and those filtered views that only come out in winter are starting to show. It’s time to look back fondly at the summer real estate market: prices are up YOY by 3% to $2,440,000 to end the quarter. This is likely more about trailing gains from a robust spring than it is about actual gains from Q3, given the indicators. A whopping 40% of homes sold under list price. It took 40% longer than 10 days to sell (not necessarily the same 40%) but only for about a 2% discount. This suggests that seller pricing and buyer motivation are evenly matched. There were 50 active listings at end of quarter, the most since Q2 of 2020 when real estate shut down completely.
Focusing on neighborhoods, The Lakes, Mercerwood, Mercerdale, and Mercer Island Estates saw 100% of homes sell in the first 10 days for an average of 102% of sales price. This goes to show that in any market, despite overall conditions, there will always be “hot homes.” Mid-Island had the most overall activity with 22 of the 68 sales across the Island. These occurred at $865/foot and 16 of the 22 homes sold in the first 10 days for at or above list price.
 Click here for the full report and neighborhood-by-neighborhood statistics!

CONDOS – SEATTLE & EASTSIDE
Once again, we’re rooting for the Seattle condo market as it proves to be the little engine that could! Chugging along toward modest price gains even when the rest of the market seems to be struggling a bit, Seattle condo prices have held steady for the last 6 quarters, with mostly positive change. Eastside condos hit a median price all-time high in Q2 at $709,000. We’re off of that a touch to $690,000 in Q3, to be expected after a beautiful summer. The Eastside ended the quarter with 29% more listings than this time last year and only 13% more sales. Mounting inventory tends to lead to price softening. Overall, nearly 50% of condos sold for at or above their list price!
When you compare the charts in the report, there is admittedly more positive news on the Eastside than in Seattle. Overall, we’re encouraged that despite many neighborhoods experiencing a drop in sales, average price per sq. ft. held flat and median price is up overall. On the Eastside it’s still great news all around for the market, especially in West Bellevue with 26% median sales price gains and total sales up 55%.
Friendly PSA: PLEASE remember that there is a ‘first rung’ of the property ladder. CONDOS create an affordable option to start building wealth at a younger age. It’s an important real estate product that has been overlooked. I am hopeful that enterprising young homeowners return to the condo market in droves this next real estate cycle.
Check out area-by-area details the full condo report.

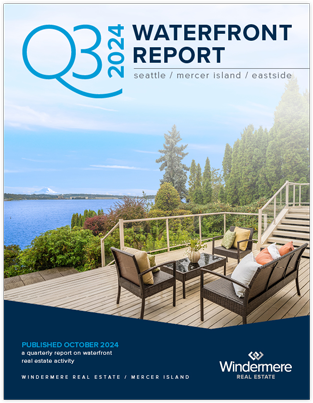
WATERFRONT
While a bit slower compared to last quarter, waterfront sales remained strong in Q3 with 10 on the Eastside and 8 in Seattle. Lake Sammamish moderated in summer with just 5 sales compared to the crazy 15 we saw in spring, while Mercer Island stayed fairly steady with 4 (compared to 6 in spring). The highest sale was nearly $18 million for an immense Wendell Lovett designed 6,920 sq. ft. home on 125 feet of prime “gold coast” waterfront in Medina. The most modest sale was also on the Eastside—an original 1943 cottage on 53 feet of west-facing waterfront in Kennydale.
This brief overview of the entire Seattle-Eastside private waterfront market, including Mercer Island and Lake Sammamish, illustrates the trends occurring in our region over time. This data is interesting and insightful but cannot replace an in-depth waterfront analysis with your trusted professional.
Find a Home | Sell Your Home | Property Research
Neighborhoods | Market Reports | Our Team
We earn the trust and loyalty of our brokers and clients by doing real estate exceptionally well. The leader in our market, we deliver client-focused service in an authentic, collaborative, and transparent manner and with the unmatched knowledge and expertise that comes from decades of experience.
2737 77th Ave SE, Mercer Island, WA 98040 | (206) 232-0446
mercerisland@windermere.com
© Copyright 2024, Windermere Real Estate/Mercer Island. Information and statistics derived from Northwest Multiple Listing Service and Trendgraphix, and deemed accurate but not guaranteed. Seattle cover photo courtesy of Kathryn Buchanan and Brandon Larson, Clarity Northwest Photography. Mercer Island cover photo courtesy of The Sirianni Group and Clarity Northwest Photography. Condo cover photo courtesy of Julie Wilson and Bobby Erdt, Clarity Northwest Photography. Waterfront cover photo courtesy of Anni Zilz and Andrew Webb, Clarity Northwest Photography.
Top 10 Predictions for 2024 Real Estate

Will 2024 be a good year for real estate? This question comes up a LOT, especially from those who are considering buying or selling a home in the near future. Housing economist Matthew Gardner weighed in with his top 10 predictions for what the real estate market will look like in the coming year. Here is what he had to say…
1. Still no housing bubble
This was number one on my list last year and, so far, my forecast was spot on. The reason why I’m calling it out again is because the market performed better in 2023 than I expected. Continued price growth, combined with significantly higher mortgage rates, might suggest to some that the market will implode in 2024, but I find this implausible.
2. Mortgage rates will drop, but not quickly
The U.S. economy has been remarkably resilient, which has led the Federal Reserve to indicate that they will keep mortgage rates higher for longer to tame inflation. But data shows inflation and the broader economy are starting to slow, which should allow mortgage rates to ease in 2024. That said, I think rates will only fall to around 6% by the end of the year.
3. Listing activity will rise modestly
Although I expect a modest increase in listing activity in 2024, many homeowners will be hesitant to sell and lose their current mortgage rate. The latest data shows 80% of mortgaged homeowners in the U.S. have rates at or below 5%. Although they may not be inclined to sell right now, when rates fall to within 1.5% of their current rate, some will be motivated to move.
4.Home prices will rise, but not much
While many forecasters said home prices would fall in 2023, that was not the case, as the lack of inventory propped up home values. Given that it’s unlikely that there will be a significant increase in the number of homes for sale, I don’t expect prices to drop in 2024. However, growth will be a very modest 1%, which is the lowest pace seen for many years, but growth all the same.
5. Home values in markets that crashed will recover
During the pandemic there were a number of more affordable markets across the country that experienced significant price increases, followed by price declines post-pandemic. I expected home prices in those areas to take longer to recover than the rest of the nation, but I’m surprised by how quickly they have started to grow, with most markets having either matched their historic highs or getting close to it – even in the face of very high borrowing costs. In 2024, I expect prices to match or exceed their 2022 highs in the vast majority of metro areas across the country.
6. New construction will gain market share
Although new construction remains tepid, builders are benefiting from the lack of supply in the resale market and are taking a greater share of listings. While this might sound like a positive for builders, it’s coming at a cost through lower list prices and increased incentives such as mortgage rate buy downs. Although material costs have softened, it will remain very hard for builders to deliver enough housing to meet the demand.
7. Housing affordability will get worse
With home prices continuing to rise and the pace of borrowing costs far exceeding income growth, affordability will likely erode further in 2024. For affordability to improve, it would require either a significant drop in home values, a significant drop in mortgage rates, a significant increase in household incomes, or some combination of the three. But I’m afraid this is very unlikely. First-time home buyers will be the hardest hit by this continued lack of affordable housing.
8. Government needs to continue taking housing seriously
The government has started to take housing and affordability more seriously, with several states already having adopted new land use policies aimed at releasing developable land. In 2024, I hope cities and counties will continue to ease their restrictive land use policies. I also hope they’ll continue to streamline the permitting process and reduce the fees that are charged to builders, as these costs are passed directly onto the home buyer, which further impacts affordability.
9. Foreclosure activity won’t impact the market
Many expected that the end of forbearance would bring a veritable tsunami of homes to market, but that didn’t happen. At its peak, almost 1-in-10 homes in America were in the program, but that has fallen to below 1%. That said, foreclosure starts have picked up, but still remain well below pre-pandemic levels. Look for delinquency levels to continue rising in 2024, but they will only be returning to the long-term average and are not a cause for concern.
10. Sales will rise but remain the lowest in 15 years
2023 will likely be remembered as the year when home sales were the lowest since the housing bubble burst in 2008. I expect the number of homes for sale to improve modestly in 2024 which, combined with mortgage rates trending lower, should result in about 4.4 million home sales. Ultimately though, demand exceeding supply will mean that sellers will still have the upper hand.
About Matthew Gardner
Matthew Gardner analyzes and interprets economic data and its impact on the real estate market on both a local and national level. Matthew has over 30 years of professional experience both in the U.S. and U.K.
Matthew also sits on the Washington State Governors Council of Economic Advisors; chairs the Board of Trustees at the Washington Center for Real Estate Research at the University of Washington; and is an Advisory Board Member at the Runstad Center for Real Estate Studies at the University of Washington where he also lectures in real estate economics.
Adapted from an article that originally appeared on the Windermere blog December 4th, 2023. Written by: Matthew Gardner.
Find a Home | Sell Your Home | Property Research
Neighborhoods | Market Reports | Our Team
We earn the trust and loyalty of our brokers and clients by doing real estate exceptionally well. The leader in our market, we deliver client-focused service in an authentic, collaborative, and transparent manner and with the unmatched knowledge and expertise that comes from decades of experience.
2737 77th Ave SE, Mercer Island, WA 98040 | (206) 232-0446
mercerisland@windermere.com