 Facebook
 X
X
 Pinterest
 Copy Link

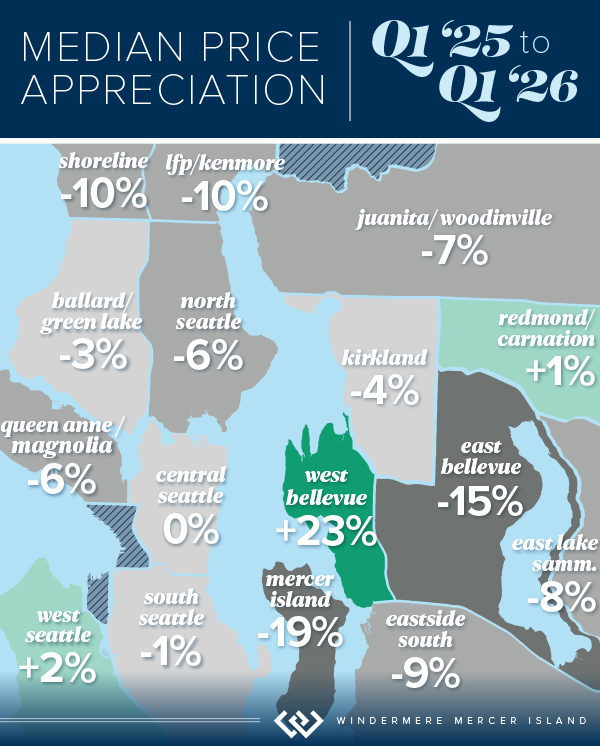
Across the region, median sales prices were lower than we saw at this time last year. The likely cause: more homes are hitting the market, but buyers (rattled by rising rates, layoffs, and an uncertain economy) aren’t keeping pace. That being said, we are still seeing many homes sell in their first 10 days on market with the choicest homes drawing multiple offers and selling above the asking price. The market is complex and every home is different…as agents, we have to look beyond the averages to get a clearer understanding of what is happening at the neighborhood level.
Despite the push in interest rates, it continues to be a good time to invest and find the right home! Buyers who are up-sizing have a special advantage when prices dip since the money they save on their purchase often exceeds the lower ROI from their sale.
Click or scroll down to find your area report:
Seattle | Eastside | Mercer Island | Condos | Waterfront
SEATTLE
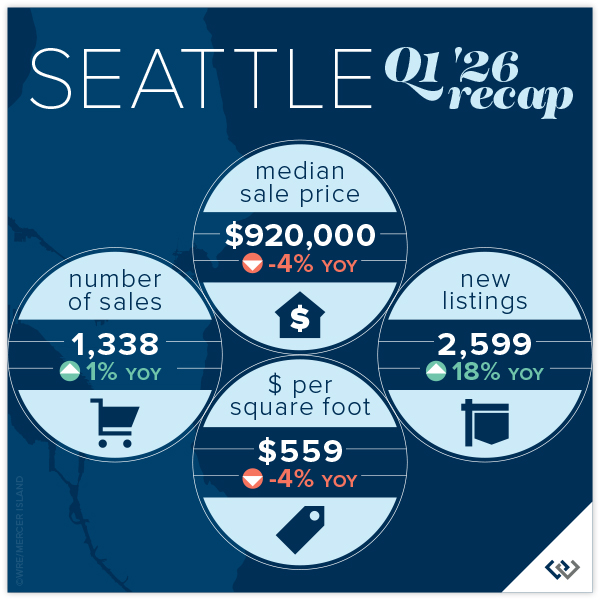
When you look past the overall data, Seattle real estate is firing on all cylinders. Even though the median price is down YOY from $958,000 in 2025 to today’s $920,000 the actual median price point is hot, in city. We’re hearing tales of multiple offers in the $800,000-$1,200,000 price range from all corners of the core Seattle neighborhoods. 67% of homes sold for at or above list price, those that sold above sold for 104% (median) over list! The entire market average list to sales price is 101%, which bodes well for gains YOY in Q2.
West Seattle and Madison Park seem to be carrying the market, the only two neighborhoods to post stable or even a modest gain in price. Maybe not so ironically, Shoreline and Lake Forest Park saw among the highest gain in overall sales volume but also the biggest losses in median price at 10%. Shoppers are savvy and know when they’ve found a deal.
While our market is facing existential pressure from things like rising interest rates, war, and talks of recession; the city hasn’t looked this beautiful in years as officials prepare for World Cup festivities in a few months. There is always a bright side, and homebuyers appear to be seeing the silver lining as they consider their long-term investment plans. If you’ve thought about selling your home in 2026, we think this could be a great year: sales are happening, 55% within the first 10 days.
Click here for the full report and neighborhood-by-neighborhood statistics!

EASTSIDE
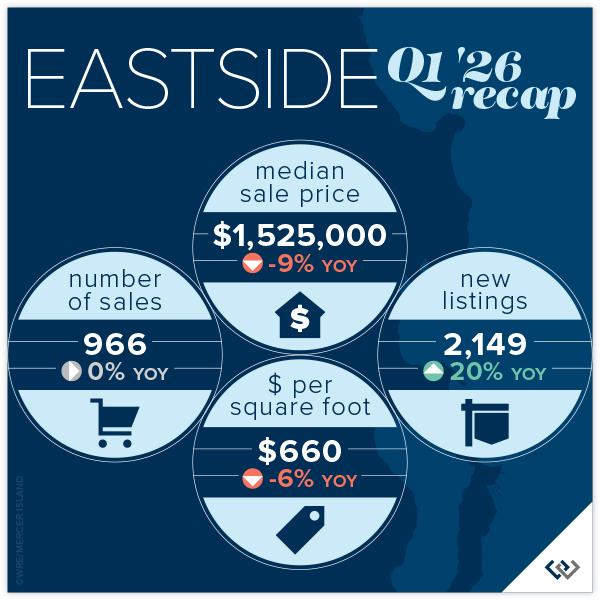
While median prices across the Eastside fell from $1,678,000 in Q1 2025 to $1,520,000, this quarter there are still bright spots. Namely, West Bellevue whose median price jumped 23% YOY. Though while the total number of sales were up in nearly every Eastside city, West Bellevue’s 36% dip drug the market down to report flat total sales: 966 at the end of Q1 2026 compared to 969 in the same period last year.
Mercer Island reported a region-wide high gain in average price per square foot at 14%, and West Bellevue was not far behind at 2%. All other neighborhoods had dips, topped by Redmond which fell 10%.
New listings rose 20% YOY, and this could mean many things but we think the two most likely are: home sellers got a head start in 2026 (we predict fewer new listings in Q2 than last year when new inventory nearly doubled from one quarter to the next) OR everyone else is as bullish about the market as we are. List to sales price ratios are at 99% on average and 51% of homes sold in the first 10 days. If you find the right home, don’t be afraid to jump.
Click here for the full report and neighborhood-by-neighborhood statistics!

MERCER ISLAND
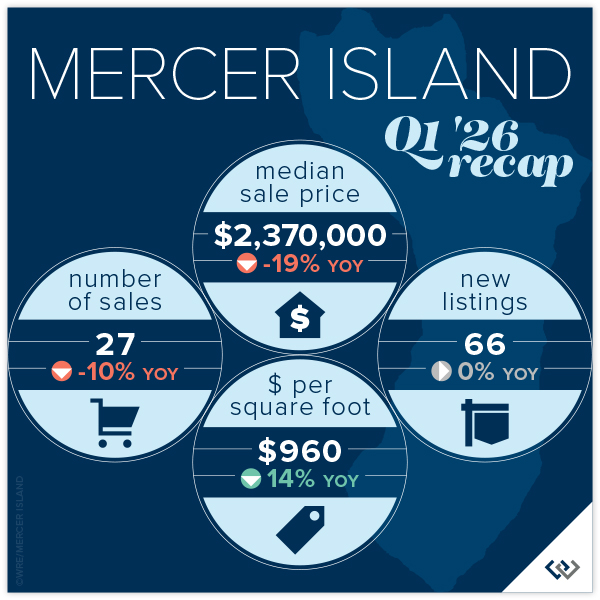
Island real estate seems to be off to a slow start in 2026 with median prices slipping YOY from $2,937,000 in 2025 to $2,370,000 in 2026. This is likely due to a spike in the months of inventory: 4.7 up from 2.9 last Q1. The months of inventory is a barometer for which way prices trend. High inventory = falling prices, supply/demand. That said, 60% of all homes sold for at or above list price and 63% sold in the first 10 days. Both of these numbers are indicators that homeowners are pricing to sell.
The condo market appears to be healthy this spring. Even though there are only 8 total sales that number is up a whopping 60% YOY. Median price is down 33%, but this is a rounding error with only 8 data points this year and 5 last year. A better indicator of market health is a 2.2 months supply of inventory, which is outpacing pretty much any segment of the market!
While our market is facing existential pressure from things like rising interest rates, war, and talks of recession; Mercer Island is now the “Bridge” in a whole new way with light rail open from Seattle to the Eastside. It will be interesting to see how this fun change affects the market as a whole.
Click here for the full report and neighborhood-by-neighborhood statistics!

CONDOS – SEATTLE & EASTSIDE
Seattle condo sales are up 8% over Q4 2025, an incredible seasonal boost. Though, the median price is down 6% YOY to $596,000. 25% of listed condos sold in the first 10 days and 48% of all condos sold for at or above list price. This tells us that agents and homeowners are tuned in to what a homebuyer in today’s market expects.
On the Eastside it’s a very similar story. Inventory is at 5.1 months. Meaning: at the current pace of sales, if no new listings came on the market, it would take nearly half a year to sell through the current inventory. That’s the highest since before 2020, the six year low was Q4 of 2021. Prices seem to reflect this, with an 11% dip in median home price down to $655,000 from Q1 2025: $740,000.
If you’ve thought about selling your condo in 2026, prepare for a highly saturated market where you’ll need to whip your unit into tip-top shape and price competitively to attract buyers. Inventory is up a combined 5%, while sales are down 21%. This is a big gap that will definitely create downward pressure on pricing if the gap between demand and supply widens. If you have the luxury to wait and watch, that might be your best option. If you’ve thought about buying, this is an excellent year to consider your options. Just remember, if you find the right nest and it hasn’t been on the market long: jump in! The good ones don’t last.
Check out area-by-area details in the full condo report.

WATERFRONT
Seattle and the Eastside both had fewer waterfront sales this quarter than we saw in Q1 of 2025, whereas Lake Sammamish posted the same number of sales and Mercer Island saw a boost. The vast majority of homes sold at or below their listed prices with the exception of one mid-century Magnolia home on 75 feet of waterfront that garnered over $300k above and beyond its original asking price.
The highest sale was in Hunts Point at $17+ million for a stunningly reimagined English Tudor on 3/4-acre with extensive waterfront. The most modest sale was in Rainier Beach: an original 1980 home on 50 feet of waterfront that went for $1,640,000.
This brief overview of the entire Seattle-Eastside private waterfront market, including Mercer Island and Lake Sammamish, illustrates the trends occurring in our region over time. This data is interesting and insightful but cannot replace an in-depth waterfront analysis with your trusted professional.
View the full waterfront report


Find a Home | Sell Your Home | Property Research
Neighborhoods | Market Reports | Our Team
We earn the trust and loyalty of our brokers and clients by doing real estate exceptionally well. The leader in our market, we deliver client-focused service in an authentic, collaborative, and transparent manner and with the unmatched knowledge and expertise that comes from decades of experience.
2737 77th Ave SE, Mercer Island, WA 98040 | (206) 232-0446
mercerisland@windermere.com
© Copyright 2026, Windermere Real Estate/Mercer Island. Information and statistics derived from Northwest Multiple Listing Service and Trendgraphix, and deemed accurate but not guaranteed.
Seattle report cover photo courtesy of The Sirianni Group; and Andrew Webb, Clarity NW Photography.
Eastside report cover photo courtesy of Tori Franzen; and Michael Tilzer Photography.
Mercer Island report cover photo courtesy of Julie Wilson; and Chris Neir, Clarity NW Photography.
Condo report cover photo courtesy of Marianne Parks; and Christopher Cooper, Clarity NW Photography.


