 Facebook
 Twitter
 Pinterest
 Copy Link

Median sales prices were up across the region in Q2 of 2024 compared to this time last year, with the Eastside posting the highest year-over-year appreciation. What should you know that the numbers don’t show? We’re back to a typical PNW seasonal market. Higher temps typically lead buyers to lose focus. There is still quality inventory hitting the market. If you don’t need to sell in order to buy, this summer is the perfect opportunity for you. There are some great deals out there, and this fall election season will be in full swing which will surely have an impact on all markets.
Click or scroll down to find your area report:
Seattle | Eastside | Mercer Island | Condos | Waterfront
SEATTLE
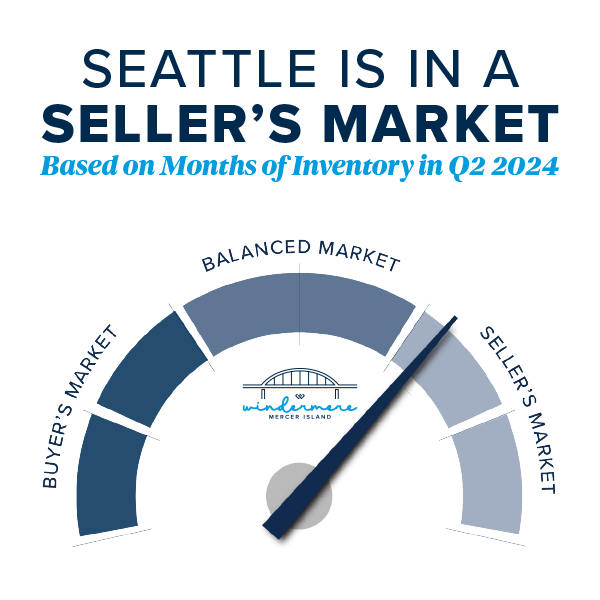
The median home price in Seattle is up 8% year over year to $970,000! We are just 3% shy of the peak median price of $1,000,000 set in Q2 of 2022. With steady growth over the last couple of quarters one might assume that we’ll hit peak prices again shortly. This gain isn’t because of low inventory (up 18%) or a rapid growth in demand (sales are down 4%), it’s likely chalked up to interest rates under 7% AND buyers got tired of sitting on the sidelines. In all cases, the first half of this year has been a breath of fresh air.
Lake Forest Park saw the biggest drop in total number of sales at 34% BUT they also saw the highest jump in median price: up 19% to $1,015,000. Their neighbors to the West, Richmond Beach and Shoreline, saw the largest rise in sales with a 19% gain in total volume AND the only area to post a drop in median price. Down 1%. Madison Park/Capitol Hill is the only other area of the city to post double digit gains. All in all a robust spring quarter.
76% of homes sold for at or above list price and 71% of homes sold in the first 10 days on the market for an average of 105% of the list price. This tells us, if you find “The One,” don’t sleep on it, and be prepared to pay. Especially in the $800,000 to $1,500,000 price band.

 Click here for the full report and neighborhood-by-neighborhood statistics!

EASTSIDE
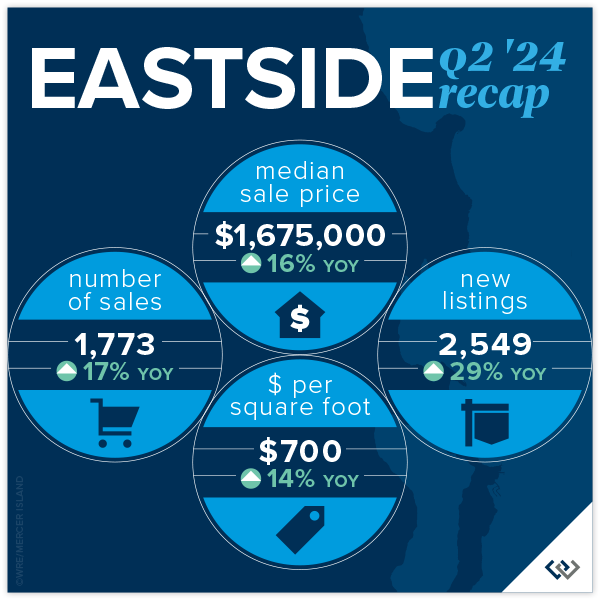
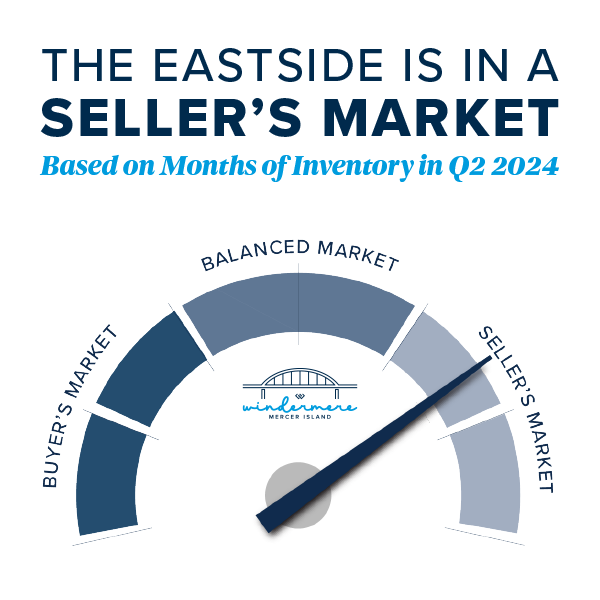
Everything’s coming up roses this spring on the Eastside. Home values have soared 16% year-over-year, with the median sale price reaching $1,675,000. This reflects a 4% gain from the peak in 2022. (Not all metro King County areas have reached peak prices again.) This impressive growth reflects a thriving market, with an average home selling for $700 per square foot, up 14% from last year. What’s even more fun? A whopping 78% of homes sold within the first 10 days of listing, showing just how bullish buyers are on the market.
Neighborhoods across the Eastside are shining. Eastside South saw 251 homes sold, marking a 37% increase, with a median sale price of $1,799,000, up 20%. Meanwhile, West Bellevue’s median sale price jumped to $3,574,000, up 13%. Mercer Island continues to charm buyers, with homes selling for an average of $906 per square foot and a median price increase of 18%, reaching $2,585,000.
Overall, the Eastside market is buzzing with activity. With 1,773 homes sold (a 17% rise YoY), it’s clear that both buyers and sellers are seizing opportunities. The increase in new listings by 29% compared to last year adds to the market’s appeal. East Bellevue and Redmond also show significant growth, with median sale prices climbing by 7% and 27%, respectively. The Eastside has staying power post Covid, clearly.
 Click here for the full report and neighborhood-by-neighborhood statistics!
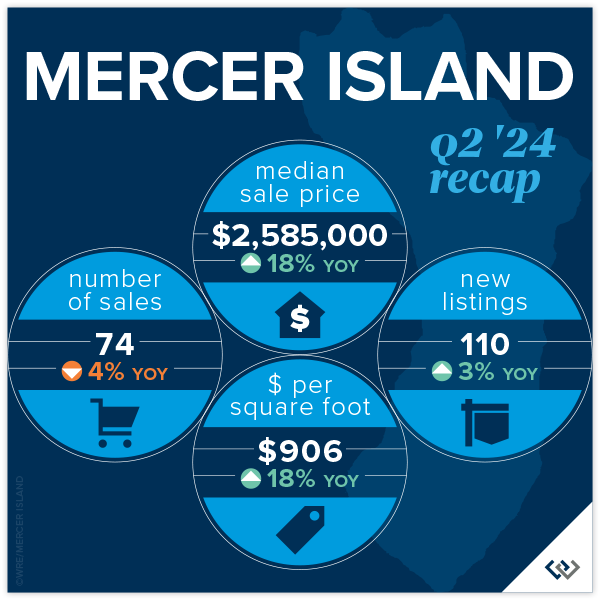
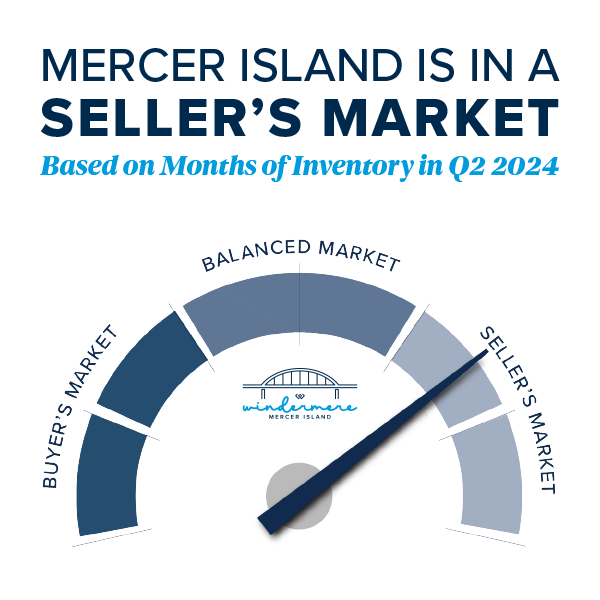
MERCER ISLAND
Home prices have seen a remarkable year-over-year increase of 18%, with the median sale price reaching $2,585,000. While this is a great sign for the health of the market, we’re still 5% below the 2022 peak. Affordability seems to be what is driving the market forward. Interest rates are down YoY. In relation to Q1 2024, prices are up a modest 2.5% which feels to us like: healthy sustainable growth.
Q2 2024 saw only a 3% rise in new listings compared to the same quarter last year, while there were 3 fewer homes sold in 2024 vs. 2023. Inventory and absorption remains relatively flat year over year. So it might be surprising that there is a robust demand for Mercer Island properties, with 66% of homes sold within the first 10 days of listing and that 18% rise in median price. Lower asking prices coupled with slight interest rate relief seem to be the explanation.
Taking a peek at the neighborhood snapshot reveals varying performance across different Mercer Island areas, yet the overall trend remains positive. For instance, the Northend saw 15 homes sold at an average of $810 per square foot, with 73% of these sales occurring at or above the listing price, and 60% sold within the first 10 days. On the higher end, East Seattle and The Lakes neighborhoods showcased exceptional performance, with all homes sold at or above the listing price and achieving 100% sales within the first 10 days. Overall, the average price per square foot for the island increased year-over-year, reaching $906.
 Click here for the full report and neighborhood-by-neighborhood statistics!

CONDOS – SEATTLE & EASTSIDE
It’s good news only in the condo market! Seattle condos saw modest yet positive growth, with the median sale price rising 5% year-over-year to $636,000. The average price per square foot climbed to $649, a 7% increase, showing strong market demand. Condos in Ballard and Green Lake led the charge with a 31% increase in sales volume, while Downtown-Belltown, despite a 14% drop in sales, saw prices rise by 10%. Demand seems to be all over the board, but we’re still reporting the highest median sales price ever for Seattle condos!
On the Eastside, the market was buzzing with activity, in large part due to inventory being double what it was in Q2 of 2023. Redmond condos were the stars, with sales skyrocketing by 65% and the median sale price jumping 45% to $850,000. West Bellevue followed suit with a 38% increase in sales and a 33% hike in price per square foot, reaching $1,064. The overall Eastside market saw a 22% rise in sales and a 13% increase in the average price per square foot, now at $660.
It’s important to note that 62% of all condos selling at or above their list price across Seattle and the Eastside, showing a competitive market where buyers are eager to snap up properties quickly. With more new listings than last year there are plenty of opportunities for buyers and sellers alike. Whether you’re eyeing a trendy spot in Ballard or a luxurious condo in West Bellevue, the upbeat condo market promises exciting possibilities for everyone!
Friendly PSA: PLEASE remember that there is a ‘first rung’ of the property ladder. CONDOS create an affordable option to start building wealth at a younger age. It’s an important real estate product that has been overlooked. I am hopeful that enterprising young homeowners return to the condo market in droves this next real estate cycle.
Check out area-by-area details the full condo report.
WATERFRONT
Lake Sammamish led the pack in Q2 with a whopping 15 waterfront sales, while the Eastside was close behind with 12. Of Seattle’s 9 waterfront sales, all but 2 sold in less than 10 days. It was a similar story with Mercer Island’s 6 sales—all but 1 sold in less than 10 days and 4 sold above the asking price. Meydenbauer took the crown for largest waterfront sale, fetching $21.3 million for a truly stunning 1-acre estate with 164 feet of waterfront and a palatial 11,000+ sq. ft. home. The most modest waterfront sale was a Rainier Beach gem on 50 feet of waterfront that sold in just 8 days for $1,725,000.
This brief overview of the entire Seattle-Eastside private waterfront market, including Mercer Island and Lake Sammamish, illustrates the trends occurring in our region over time. This data is interesting and insightful but cannot replace an in-depth waterfront analysis with your trusted professional.
Main photo courtesy of Wing Walker Aerial Photography

Find a Home | Sell Your Home | Property Research
Neighborhoods | Market Reports | Our Team
We earn the trust and loyalty of our brokers and clients by doing real estate exceptionally well. The leader in our market, we deliver client-focused service in an authentic, collaborative, and transparent manner and with the unmatched knowledge and expertise that comes from decades of experience.
2737 77th Ave SE, Mercer Island, WA 98040 | (206) 232-0446
mercerisland@windermere.com
© Copyright 2024, Windermere Real Estate/Mercer Island. Information and statistics derived from Northwest Multiple Listing Service and Trendgraphix, and deemed accurate but not guaranteed. Seattle cover photo courtesy of Codi Nelson and HD Estates Photography. Eastside cover photo courtesy of Donovan Realty Group and Tucker English Photography. Mercer Island cover photo courtesy of Yvonne Willard and Ryan Slimak, Clarity Northwest Photography. Condo cover photo courtesy of Luke Bartlett and Matthew Gallant, Clarity Northwest Photography. Waterfront cover photo courtesy of Kathryn Buchanan and Brandon Larson, Clarity Northwest Photography.


