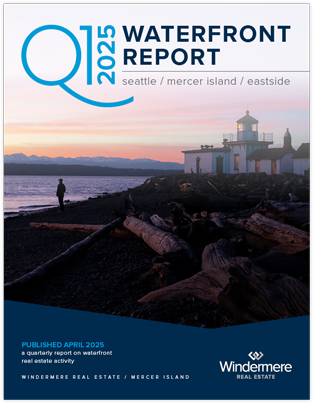
Q1 started the year off strong for Seattle-area real estate with the majority of homes selling in the first 10 days on the market and for at or above their listed prices. Median sales prices were also up compared to Q1 of last year. Buyers enjoyed more choice with new listings outpacing sales, steadily increasing our supply of available homes for sale.
What the numbers don’t show yet is that the spring market sprang early, in January and February; now that prime inventory is hitting the market, demand appears to be waning. Our advice to Home Shoppers: don’t take any chances. Just because the last new listing didn’t sell in a competitive situation, doesn’t mean the next one won’t. If you love the home, act with confidence. Our advice to Home Sellers: don’t take any chances. Prep well, price appropriately, and take that first buyer seriously. It’s unpredictable out there.
Click or scroll down to find your area report:
Seattle | Eastside | Mercer Island | Condos | Waterfront
SEATTLE
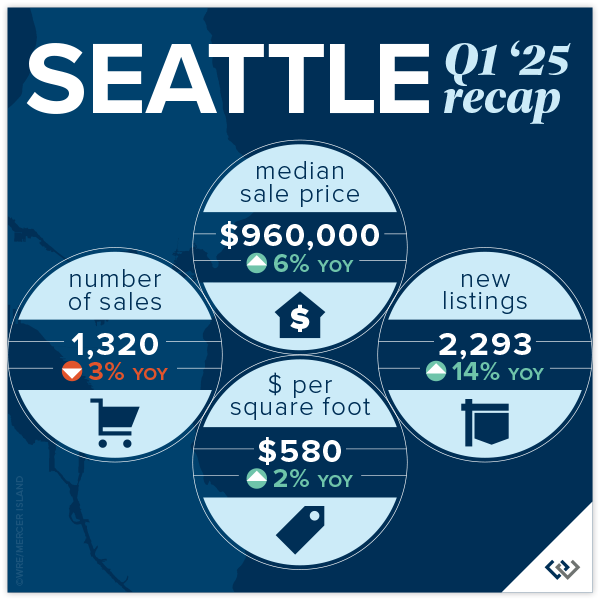
The Seattle real estate market continues to show encouraging signs of strength and stability as we step into 2025. Median home prices rose 6% year-over-year to $960,000, building on the 9% increase we saw in Q1 2024 and rebounding from $830,000 in Q1 2023. That’s a remarkable $130,000 gain in just two years. Inventory is also trending in the right direction, with 2,293 new listings this quarter—up 14% from Q1 2024 and significantly higher than the 1,958 new listings in Q1 2023. It appears that need is outweighing the pull of a sub 3% interest rate when considering whether or not to make a move.
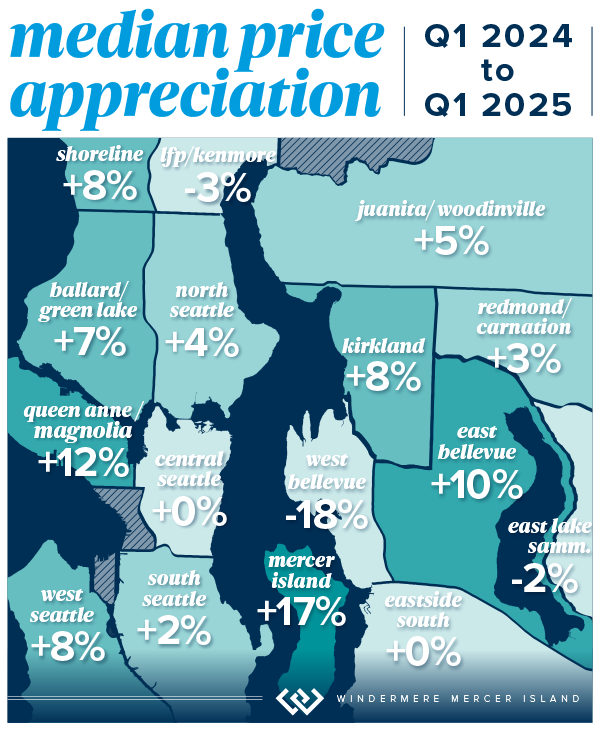
Momentum is visible across several neighborhoods. West Seattle, for instance, saw 75% of homes sell at or above list price (up from 71% last year and 70% the year before), while North Seattle maintained its reputation for competitive sales—70% sold at or above list and 66% sold in the first 10 days. Madison Park & Capitol Hill remained a strong performer with an impressive median price of $1,100,000; holding steady year-over-year after a 10% jump last year.
Citywide, 71% of homes sold at or above list price—up from 69% in Q1 2024—and the average price per square foot increased to $580, up 2% from last year. Quick market movement also continues to be a theme, with 62% of homes going pending in the first 10 days.
Click here for the full report and neighborhood-by-neighborhood statistics!
EASTSIDE
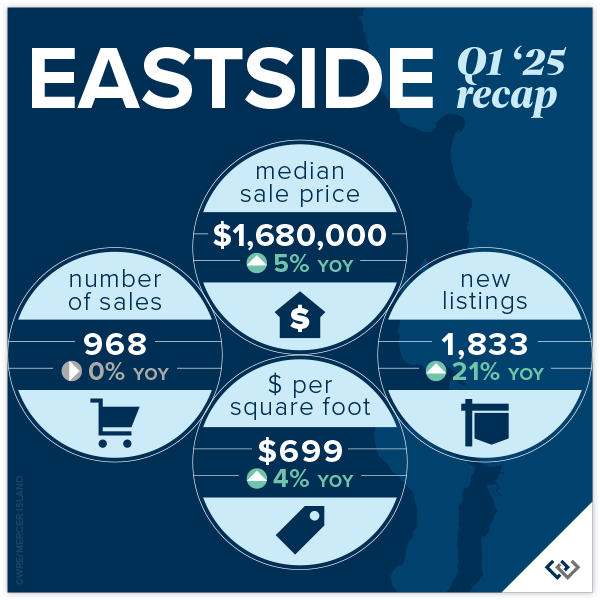
The Eastside market continues its upward momentum, with a 5% year-over-year increase in median sale price to $1,680,000 in Q1—building on the 14% jump reported in Q1 2024 and the remarkable recovery from Q1 2023’s $1,400,000 low. This marks a $280,000 increase over two years, a clear signal of sustained buyer demand and market strength.
Homes are moving quickly, with 69% selling in the first 10 days—up from 65% last year. Additionally, 72% of homes sold at or above list price, improving consistently from 68% in 2024. East Bellevue (E of 405) stood out with 83% of homes selling in the first 10 days and a 10% jump in median price—continuing its leadership in market competitiveness in recent years.
We also saw notable activity in Redmond, where sales rose 10% and 75% of homes sold in the first 10 days. Kirkland held strong as well, with an 8% increase in median price to $2.21M after last year’s 32% gain. And despite West Bellevue’s sharp 18% price dip, it remains one of the most valuable submarkets with a median price of $3,200,000.
The listing count jumped 21% year-over-year, with 1,833 homes hitting the market—finally turning a corner after multiple years of historically low inventory. Overall average price per square foot also increased 4% to $699.
Click here for the full report and neighborhood-by-neighborhood statistics!
MERCER ISLAND
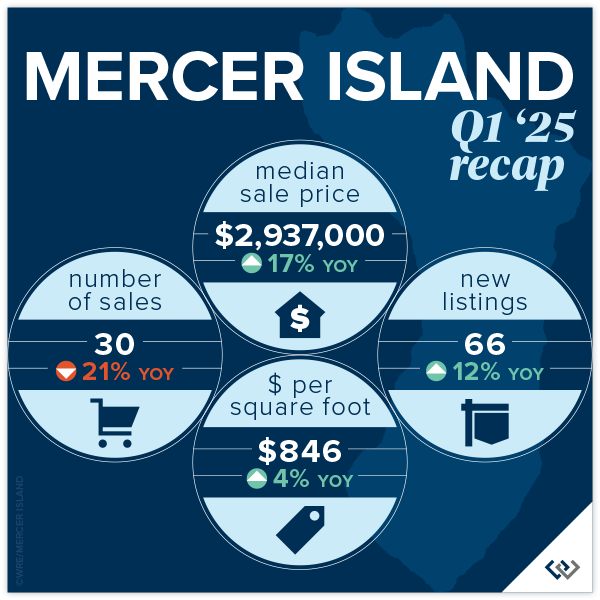
Mercer Island’s real estate market launched into 2025 with remarkable momentum. Median sale prices surged 17% year-over-year to $2,937,000—outpacing both Q1 2024’s 13% growth and 2024’s full-year 11% rise. This continued appreciation reflects strong buyer demand and an increase in high-value transactions across neighborhoods like Southend and Northend, which posted some of the highest median sales at $4,401,000 and $4,012,000 respectively.
While total sales volume declined by 21% from Q1 2024, due in part to seasonally low inventory, the market remained highly competitive. Over half (53%) of homes sold within the first 10 days—down from 73% in Q1 2024 but still a strong indicator of buyer urgency. Likewise, 47% of homes sold at or above list price, a notable drop from last year’s 65%, but consistent with Q1’s evolving pace as buyers exercise more discretion amid shifting macro conditions.
Inventory began to bounce back with 66 new listings—12% more than Q1 2024—signaling renewed confidence from sellers. Price per square foot rose modestly by 4% to $846, continuing the stable value trend seen in prior quarters.
 Click here for the full report and neighborhood-by-neighborhood statistics!
CONDOS – SEATTLE & EASTSIDE
The condo market is off to a strong and balanced start in 2025. With a 15% year-over-year increase in Seattle’s median condo price—now at $635,000—and a 9% increase on the Eastside to $735,000, it’s clear that confidence is returning to this sector. Seattle posted a 19% rise in condo sales, while Eastside transactions grew 15%, building on the momentum established last year. Go Seattle Go! We’re always rooting for downtown condo recovery.
Woodinville condos were the breakout stars this quarter, with a remarkable 108% rise in median sale price and 41% more units sold. Likely due to new construction projects in wine country. Redmond followed suit, reporting a 27% price jump and 36% growth in volume. Meanwhile, West Bellevue remains the most expensive submarket at $1,045,000, despite some pricing fluctuations. Seattle’s North End also had a strong showing, with prices up 3% and more than half of condos selling at or above list price.
In terms of competitiveness, Mercer Island stood out with 80% of its (5) sales happening in the first 10 days—up from 52% last year. This level of demand echoes across the Eastside, where 44% of homes sold within 10 days, up from 39% last year. Seattle mirrored this pace with 35% selling in the first 10 days.
Inventory has expanded as well. New condo listings rose 34% over last year, providing buyers with more choice while keeping upward pressure on prices. The condo market is proving to be as unpredictable as all things in the US today. There are certainly bright spots and it we are cautiously optimistic that Home Shoppers are considering condos a realistic option, unlike years past.
Check out area-by-area details the full condo report.
WATERFRONT
Seattle led the pack with 10 waterfront sales in Q1 of 2025, including the highest sale in the region—an immense 15,321 square foot Magnolia home on over 3 acres and 293 feet of waterfront that sold for $21,500,000. All but 3 of Seattle’s waterfront homes sold within the first 10 days on the market with one Lake Forest Park home going for $160,000 above the asking price.
The Eastside also posted some impressive Q1 sales, including a $16m Hunts Point sanctuary and a $13.125m Italian-inspired stunner at Mercer Island’s southern tip. The most modest waterfront sale was an original 1968 beach house on 58 feet of lakefront in Bellevue that sold for $1,750,000.
This brief overview of the entire Seattle-Eastside private waterfront market, including Mercer Island and Lake Sammamish, illustrates the trends occurring in our region over time. This data is interesting and insightful but cannot replace an in-depth waterfront analysis with your trusted professional.

Find a Home | Sell Your Home | Property Research
Neighborhoods | Market Reports | Our Team
We earn the trust and loyalty of our brokers and clients by doing real estate exceptionally well. The leader in our market, we deliver client-focused service in an authentic, collaborative, and transparent manner and with the unmatched knowledge and expertise that comes from decades of experience.
2737 77th Ave SE, Mercer Island, WA 98040 | (206) 232-0446
mercerisland@windermere.com
© Copyright 2025, Windermere Real Estate/Mercer Island. Information and statistics derived from Northwest Multiple Listing Service and Trendgraphix, and deemed accurate but not guaranteed. Seattle cover photo courtesy of Brooke Davis and Northwest’s Best Real Estate Video & Photography. Eastside cover photo courtesy of Joe C. Liu and Clarity Northwest Photography. Condo cover photo courtesy of Andrea Iverson and Andrew Webb, Clarity Northwest Photography.

 Facebook
 X
X
 Pinterest
 Copy Link
