Market Reports October 18, 2021

How’s the Market? Q3 Real Estate Review

The frenetic pace of Seattle-area real estate continued in Q3, with the number of sales and median sales prices both up across the region compared to this time last year. Seattle condo sales saw a healthy year-over-year jump as they continued to recover from the COVID slump we saw in 2020.


While buyers still contended with a lack of inventory and stiff competition for available homes, our continued low interest rates were the silver lining. Those obtaining financing were buoyed up by lower mortgage payments and increased buying power compared to times when rates are higher.


Click or scroll down to find your area report:

Seattle  |  Eastside  |  Mercer Island  |  Condos  |  Waterfront


SEATTLE

Seattle’s Median Sale Price increased by 8% to $865,500 (up from $800,000 in Q3 2020). Neighborhoods in Lake Forest Park-Kenmore (+19%), Shoreline (+13%), North Seattle (+10%), West Seattle (+10%), and Queen Anne-Magnolia (+9%) outperformed the average while South Seattle (+8%) stayed on par and Ballard-Green Lake (+5%) and Central Seattle (+2%) lagged behind.


There was an 8% increase in the number of Seattle homes sold in the third quarter of 2021 (3171) compared to Q3 2020 (2929) despite the tight supply of homes for sale. Central Seattle (+20%) and North Seattle (+18%) had the largest increases over Q3 2020 in number of homes sold.


79% of all Seattle homes, and 28% of those priced above $1 million, sold at or above the list price. The average of all homes sold closed at a price 4% more than list. Price increases were even more dramatic when homes sold in their first ten days on the market—with an average sale price of 7% above list price. The most competitive neighborhoods were North Seattle and South Seattle, with first 10-day sales averaging 9% and 8% above list price, respectively.


Seattle Recap

Click here for the full report and neighborhood-by-neighborhood statistics!

Seattle Report


↑ Back to top


EASTSIDE

The Eastside’s Median Sale Price was $1,325,500 in the third quarter of 2021, up 29% over Q3 2020 ($1,025,100). Buyer demand outpacing the supply of homes for sale was the biggest factor fueling this increase. Mercer Island, (+42%), Redmond (+32%), Sammamish (+32%), and South Eastside (+32%) saw the largest gains, while Woodinville (+23%) had the smallest year-over-year increase.


87% of all Eastside homes, and 65% of homes priced above one million dollars, sold for at or above their list price. With 59% fewer homes for sale than in Q3 2020, the entire Eastside market remained ultra-competitive. The average of all homes sold was 7% above list price. Homes sold within the first ten days went for an average of 11% above list price. The most competitive neighborhoods were East Bellevue and South Eastside, with first 10-day sales averaging 13% and 12% above list price, respectively.


The Eastside market saw Months of Inventory (the number of months it would take to sell all homes currently for sale) remain at historical lows of between 0.3 and 0.4 months. Many Eastside communities have had only a handful of homes for sale at any one time.


Eastside Recap

Click here for the full report and neighborhood-by-neighborhood statistics!

Eastside Report


↑ Back to top


MERCER ISLAND

Fewer than two dozen homes for sale on the Island at any given time has led to a continued ultra-competitive market and unpredictable shifts in median sale price as a result. It’s worth noting that a few very high-end waterfront home sales skewed the median sale price upward as compared to last year.


In the third quarter of 2021, 75% of all homes sold at or above their listed price. Sellers who prepped and priced their homes competitively reaped huge rewards from bidding wars—those that sold in the first 10 days on market closed for an average of 10% above their list price.


On the other hand, those properties that were not immediately snapped up tended to sell at a discount. Homes on the market 11-30 days sold for an average of 3% below their list price, while homes on the market longer than 30 days sold for an average of 5% below their list price. Pricing and condition tended to separate the “haves” from the “have nots” when it came to selling quickly.


Mercer Island Recap

Click here for the full report and neighborhood-by-neighborhood statistics!

Mercer Island Report

↑ Back to top


CONDOS – SEATTLE & EASTSIDE

Condos did quite well overall in the third quarter of 2021 as single-family home markets became more competitive, and in some cases, unattainable.


Seattle condos saw a 3% increase (to $492,750) and Eastside condos saw a 10% increase (to $551,619) in Median Sale Price compared to Q3 2020.


62% of Seattle condos and 78% of Eastside condos sold at or above their listed price. Those sold in the first 10 days on the market went for an average of 2% and 5% above their list price, respectively.


Check out area-by-area details the full condo report.


Condo Report

↑ Back to top


WATERFRONT

The waterfront home market continues to see incredible buyer demand while also suffering from an extreme shortage of available homes for sale. Nearly every waterfront home listed for sale sold in record time, some for jaw-dropping prices. The Eastside had 23 waterfront home sales in the third quarter of 2021 while Seattle had 22 Q3 waterfront sales, Mercer Island had 15, and Lake Sammamish had 10 waterfront sales. More than half of waterfront homes listed for sale went under contract in mere days, with an average market time still a fraction of that of a more typical year.


As an indicator of demand in the luxury segment, with few outliers, most homes sold near to or above their list price—something that historically has rarely happened in this sector.


This brief overview of the entire Seattle-Eastside private waterfront market, including Mercer Island and Lake Sammamish, illustrates the trends occurring in our region over time. This data is interesting and insightful but cannot replace an in-depth waterfront analysis provided by a savvy broker with years of local waterfront experience.


Waterfront Report

↑ Back to top


Mercer island blog, windermere mercer island, windermere real estate, seattle blog, live on mercer, live on guides, community information, neighborhood information, real estate, mercer island community, mercer island community blog, mercer island blogger, mi reporter, mercer island real estate info,

Find a Home | Sell Your Home | Property Research

Neighborhoods | Market Reports | Our Team

We earn the trust and loyalty of our brokers and clients by doing real estate exceptionally well. The leader in our market, we deliver client-focused service in an authentic, collaborative, and transparent manner and with the unmatched knowledge and expertise that comes from decades of experience.

2737 77th Ave SE, Mercer Island, WA 98040 | (206) 232-0446
mercerisland@windermere.com

© Copyright 2021, Windermere Real Estate/Mercer Island. Information and statistics derived from Northwest Multiple Listing Service and deemed accurate but not guaranteed.

Market Reports July 8, 2021

How’s the Market? Q2 Real Estate Review

Buyers found no relief as our region’s extreme sellers’ market continued skyward. Strong home buyer demand simply outpaced the number of available properties for sale. Fierce competition drove prices up 15% in Seattle and a staggering 38% on the Eastside as compared to Q2 of 2020. While COVID played a factor in early 2020; all things considered, prices have increased substantially in the first half of 2021.


Home affordability, or unaffordability, is one of the most significant factors impacting our communities. Many first-time buyers, retirees, and moderate wage earners are finding the tri-county region of King, Snohomish, and Pierce Counties simply out of reach…or find themselves settling for accommodations that are far less than expected. The Seattle area, much like other high-priced markets across the country, has become a region where only the affluent can afford to own real estate.


As we move into the summer, buyer fatigue, coupled with COVID reopening of recreation and vacation opportunities, may provide much needed dampening of buyer demand. Our market desperately needs more balance between buyers and sellers in the market.


Click or scroll down to find your area report:

Seattle  |  Eastside  |  Mercer Island  |  Condos  |  Waterfront


SEATTLE

Seattle’s Median Sale Price increased by 15% to $895,000 (up from $780,000 in Q2 2020). North end neighborhoods in Shoreline (+37%), Lake Forest Park-Kenmore (+37%), and North Seattle (+18%) outperformed the average while South Seattle (+9%), West Seattle (+11%). and Central Seattle (+12%) lagged slightly behind.


There was a 74% increase in the number of Seattle homes sold in Q2 (3,404) compared to Q2 2020 (1,956)—much of which can be attributed to COVID-related factors. Central Seattle (+116%) and West Seattle (+90%) had the largest increases in number of homes sold.


86% of all Seattle homes, and 33% of those priced above $1 million, sold at or above list, with the average of all homes sold at prices 6% more than list. Price increases were even more dramatic when homes sold in their first ten days on the market (76% of all listings) with an average sale price of 10% above list price. The most competitive neighborhoods were Kenmore-Lake Forest Park and North Seattle, with first 10-day sales averaging 15% and 13% above list price, respectively.


Seattle Recap

Click here for the full report and neighborhood-by-neighborhood statistics!

Seattle Report


↑ Back to top


EASTSIDE

The Eastside’s Median Sale Price was $1,320,355 in Q2, up 38% over Q2 2020 ($958,000). Buyer demand outpacing the supply of homes for sale was the biggest factor fueling this increase. Redmond, (+48%), Kirkland (+48%), and South Eastside (+45%) saw the largest gains, while West Bellevue (+7%) had the smallest year-over-year increase.


93% of all Eastside homes, and 68% of homes priced above one million dollars, sold for at or above their list price. With 70% fewer homes for sale than in Q2 2020, the entire Eastside market remained ultra-competitive. The average of all homes sold was 9% above list price and homes sold within the first ten days went for an average of 13% above list price.


The Eastside market saw Months of Inventory (the number of months it would take to sell all homes currently for sale) remain at historical lows of between 0.3 and 0.4 months. Many Eastside communities have had only a handful of homes for sale at any one time.


Eastside Recap

Click here for the full report and neighborhood-by-neighborhood statistics!

Eastside Report


↑ Back to top


MERCER ISLAND

Fewer than two dozen homes for sale on the Island at any given time has led to a continued ultra-competitive market with 90% of all homes sold at or above their listed price. Those sold in the first 10 days on market (77% of all sales) closed for an average of 13% above their list price. Homes on the market 11-30 days sold for an average of 1% above list and homes on the market longer than 30 days sold for an average of 4% below their list price.


Mercer Island Recap

Click here for the full report and neighborhood-by-neighborhood statistics!

Mercer Island Report

↑ Back to top


CONDOS – SEATTLE & EASTSIDE

Condo demand surged in Q2 as single-family home markets became more competitive, and in some cases, unattainable.


Seattle condos saw a 7% increase (to $488,750) and Eastside condos saw a 5% increase (to $550,000) in Median Sale Price compared to Q2 2020. Fueled by new construction development, South Seattle saw a three-fold increase in the number of condos sold, while the number of West Bellevue condos sold was up nearly double.


61% of Seattle condos and 80% of Eastside condos sold at or above their listed price. Those that were sold in the first 10 days (48% of Seattle and 70% of Eastside sales) sold for an average of 2% and 5% above their list price, respectively.


Check out area-by-area details the full condo report.


Condo Report

↑ Back to top


WATERFRONT

Waterfront listings were swooped up by buyers nearly as quickly as they came to market, some for staggering margins. Lake Sammamish had a record 18 sales while the Eastside had 17, Seattle 14, and Mercer Island had 7. Many waterfront homes went under contract in mere days, with an average market time in the teens instead of months.


As an indicator of demand in the luxury segment, most homes sold above their list price—something that historically has rarely happened in this sector. Some of most competitive homes sold for outrageously more than their list price as affluent buyers opened their pocketbooks for the win.


This brief overview of the entire Seattle-Eastside private waterfront market, including Mercer Island and Lake Sammamish, illustrates the trends occurring in our region over time. This data is interesting and insightful, but can’t replace an in-depth waterfront analysis provided by a savvy broker with years of local waterfront experience.


↑ Back to top


Mercer island blog, windermere mercer island, windermere real estate, seattle blog, live on mercer, live on guides, community information, neighborhood information, real estate, mercer island community, mercer island community blog, mercer island blogger, mi reporter, mercer island real estate info,

Find a Home | Sell Your Home | Property Research

Neighborhoods | Market Reports | Our Team

We earn the trust and loyalty of our brokers and clients by doing real estate exceptionally well. The leader in our market, we deliver client-focused service in an authentic, collaborative, and transparent manner and with the unmatched knowledge and expertise that comes from decades of experience.

2737 77th Ave SE, Mercer Island, WA 98040 | (206) 232-0446
mercerisland@windermere.com

© Copyright 2021, Windermere Real Estate/Mercer Island. Information and statistics derived from Northwest Multiple Listing Service and deemed accurate but not guaranteed.

Market Reports April 12, 2021

How’s the Market? Q1 Real Estate Review…

An extreme sellers’ market, driven by too few homes for sale and incredibly low mortgage interest rates, led to the most aggressive multiple offer bidding wars we have experienced in our region. There are simply dozens of buyers for nearly every home that comes to market. To be competitive, most buyers did their home research prior to writing an offer, waived typical protective contingencies—including financing, appraisal, title, and inspection—and drained their savings and investment accounts to pay cash or fund discrepancies between the purchase price and appraised value.


The ability to secure a suitable home in a neighborhood of choice is a luxury not afforded to many buyers, regardless of assets. Indeed, the lack of inventory for sale and competitiveness of the market has kept many current homeowners from moving to a home that would better suit their needs or commute.


Home affordability, or unaffordability, is at crisis levels. Most homes are completely unaffordable to first-time buyers and moderate wage earners who are finding it increasingly difficult to work and live within King County. Snohomish and Pierce Counties are not far behind. While cities and counties are coming to the table to address this issue, the potential solutions will take years to implement and see relief.


Time will tell if For Sale inventory levels will increase as we move further into our peak spring season market.


Click or scroll down to find your area report:

Seattle  |  Eastside  |  Mercer Island  |  Condos  |  Waterfront


SEATTLE

Seattle’s Median Sale Price increased by 7% to $800,000 (up from $750,000 a year ago in Q1 2020). Shoreline (+11%), Lake Forest Park-Kenmore (+11%), and South Seattle (+9%) outperformed the average while West Seattle (-2%) and Queen Anne-Magnolia (+4%) lagged.


There was a 39% increase in the number of Seattle homes sold in Q1 (2,271) compared to Q1 2020 (1,632)—much of which can be attributed to emerging COVID concerns in 2020 coupled with increased mobility in 2021. Queen Anne-Magnolia (+91%), West Seattle (+51%), and North Seattle (+47%) had the largest increases in number of homes sold, although all neighborhoods except Lake Forest Park-Kenmore saw double-digit increases in total sales.


75% of all Seattle homes, and 19% of those priced above $1 million, sold at or above their listed price. The most competitive Seattle markets were Kenmore-Lake Forest Park and North Seattle, with sales in the first 10 days averaging 111% and 110% of their listed price, compared to the 107% average for all Seattle neighborhoods combined.


Seattle Recap

Click here for the full report and neighborhood-by-neighborhood statistics!

Seattle Report


↑ Back to top


EASTSIDE

The Eastside’s Median Sale Price was $1,300,000 in Q1, up 31% over Q1 2020 ($989,950). Movement of companies and households to the Eastside and the extreme lack of a supply of homes for sale were the biggest contributors to this increase. South of I-90 (+39%) saw the largest gains, while the higher-priced markets of Kirkland (+16%), Mercer Island (+17%), and West Bellevue (+22%) had the smallest year-over-year increases—although being well into the double-digits, they could hardly be considered small.


85% of all Eastside homes, and 59% of homes priced above one million dollars, sold for at or above their list price. With 71% fewer homes for sale than in Q1 2020, the entire Eastside market remained ultra-competitive. East Bellevue sales topped the charts with an average sale price of 112% above list price for sales occurring in the first 10 days on the market.


The Eastside market saw Months of Inventory (the number of months it would take to sell all homes currently for sale) remain at historical lows of between .3 and .6 months. Despite the limited supply of homes for sale, there was a 25% increase in the number of Eastside homes sold in Q1 (1,413) compared to Q1 2020 (1,133)—much of which can be attributed to emerging COVID concerns in 2020 and in-migration to the Eastside.


Eastside Recap

Click here for the full report and neighborhood-by-neighborhood statistics!

Eastside Report


↑ Back to top


MERCER ISLAND

Most notable on the Island was the continued lack of affordable housing options with no sales below $1 million, and only 10 sales below $1.5 million, in Q1. High end sales dominated the market with 30 of the Island’s 64 sales of homes priced $2 million and above. Mercer Island waterfront listings remained depleted with an average of 2 waterfront homes for sale at any given time and a mere 3 sales in all of Q1.


Q1 saw an average of only 17 homes available for sale—an unbelievable low for a typically burgeoning Q1 on the Island. This has led to a continued ultra-competitive market for the most desirable homes, especially those offering one-level living, a main floor owner’s suite or prime waterfront.


A staggering 81% of all homes sold at or above their listed price and those that sold in the first 10 days (75% of all sales) closed for an average of 110% of their listed price. That increase equated to sellers receiving an average of nearly $200,000 above their listed price at Island’s median sale price.


Mercer Island Recap

Click here for the full report and neighborhood-by-neighborhood statistics!

Mercer Island Report

↑ Back to top


CONDOS – SEATTLE & EASTSIDE

Condos have remained an attractive and more affordable option for entry-level buyers who might otherwise rent. As single-family home markets become more competitive, condo ownership becomes a more compelling—and many times the only—option for those wishing to begin their homeownership journey.


While the number of single-family homes for sale has been on the decline regionally, Seattle condos experienced a 45% increase in the number of units for sale while Eastside condos saw 23% fewer units for sale compared to Q1 2020. Both Seattle (+18%) and the Eastside (+30%) saw an increase in the number of Q1 sales.


Seattle condos saw a 3% increase (to $476,000) and Eastside condos saw a 9% increase (to $535,000) in Median Sale Price compared to Q1 2020. Fueled by new construction townhome development, South Seattle posted a 56% increase in its Median Sale Price during that same period. On the Eastside, with townhomes providing a solid alternative to lacking single-family homes, Sammamish was a standout with a 16% increase over Q1 2020


51% of Seattle condos and 70% of Eastside condos sold at or above their listed price. Those that were sold in the first 10 days (35% of Seattle and 55% of Eastside sales) sold for an average of 103% of their listed price.


Check out area-by-area details the full condo report.


Condo Report

↑ Back to top


WATERFRONT

With a meager combined average of only 7 homes for sale (compared to 26 in Q1 2020) Mercer Island and Eastside waterfront headlines could only read that there was nearly nothing available for sale in Q1. The Seattle market was just above typical inventory levels (with an average of 12 homes for sale compared to 10 in Q1 2020) while Lake Sammamish maintained its two-year running low of 5 homes for sale.


While many waterfront homes went under contract in mere days, they did not see the dramatic price escalations in Q1 that the more affordable, non-waterfront market has experienced. In fact, only one sale closed at (a fraction of 1%) above its listed price. While 4 of the 14 Q1 sales closed at 100% of their listed price, a fair amount of price negotiation was far more common.


This top-level overview of the entire Seattle-Eastside private waterfront market, including Mercer Island and Lake Sammamish, provides a glance into the trends occurring in our region over time. It is interesting, and insightful, but in no way replaces an in-depth analysis on waterfront value provided by a savvy broker with years of local waterfront experience.


↑ Back to top


We earn the trust and loyalty of our brokers and clients by doing real estate exceptionally well. The leader in our market, we deliver client-focused service in an authentic, collaborative and transparent manner and with the unmatched knowledge and expertise that comes from decades of experience.

© Copyright 2021, Windermere Real Estate/Mercer Island. Information and statistics derived from Northwest Multiple Listing Service and deemed accurate but not guaranteed.

Home Seller Tips December 18, 2020

The Downside of Selling Your Home Off Market

Who wouldn’t want the enticement of a full price offer on their home before it even comes to market? At first glance it seems like a compelling opportunity, but it comes at a steep price.

With the shortage of homes today, friends and neighbors are all on the lookout for up-and-coming listings. They aren’t hard to spot amongst the buzz of spruce up activity that often occurs as a home is being prepped for the market. Often the buyer or their broker contact the seller or their broker to request an early showing and you can guess what transpires from there. You and your broker have a list price in mind and the buyer’s offer comes in at that price. What could be better?

Are you leaving money on the table?

For starters, consider that homes in the Seattle-Eastside region are typically selling well above their asking prices. Local market data shows most homes bring in 3-8% above their listed prices during the last several months. This occurs when multiple buyers are competing for the same property…something that doesn’t happen when negotiating off market with a single buyer. Consider a home at Seattle’s median price of $800,000, 3-8% equates to $24,000-$64,000 left on the table.

But that isn’t all there is to consider. In our current highly competitive market, it isn’t unusual for buyers to waive contingencies such as financing and appraisal, pre-inspect or waive the inspection contingency, and often even release their earnest money as non-refundable. This does not often happen in a non-competing situation and leaves you vulnerable to transaction challenges before closing.

In addition, it is often the buyers who can’t effectively compete in an open market that are most motivated to try to get you to sell off market. This benefits the buyer significantly, but eliminates the benefits to you of a strong seller-favored market.


What about iBuyer company offers?

iBuyers are companies that agree to pay a set amount for your home up front and then list it for sale after you move out. They have gained popularity in some markets-Phoenix and Atlanta especially. In 2019, they had 59,000 transactions nationwide or about half of one percent market share of the 5.38 million transactions last year. Amidst COVID and economic concerns, iBuyer market share was down dramatically in 2020 and remains uncertain for 2021.

Nationally, their sweet spot has been predictable subdivision homes priced around $250,000. They have traditionally avoided higher priced markets due to the added risk in pricing. And they have historically avoided Washington State because of our real property transfer tax that adds ~2% to the cost of sale.

While selling to an iBuyer might seem easy and intriguing, it helps to remember these companies are in business to make a profit at your expense. iBuyers charge a 6-10% service fee in addition to factoring in the cost of needed repairs or updates (data shows an average of 2-5% of the sale price). Atypical expenses, like our state’s 2% transfer tax, are also calculated into the net. Add it all up and it is a hefty price to pay for the convenience of not having to go through the sale process.

On other thing to note is that iBuyers also profit by selling the names of homeowners who contact them for a bid, but do not accept that bid (93-98% of inquiries, depending on the company), to real estate agents without an established client base who are willing to pay for leads. These are typically not the most successful real estate brokers in a given marketplace. Not only do sellers who use these brokers often lose out on the benefits of working with a knowledgeable and established Realtor, that broker’s marketing budget is consumed largely by paying for leads instead of prominently marketing your home.


Final thoughts

It’s so easy to get caught up in the whirlwind of an off-market offer. And it’s flattering to feel like your home is so appealing that people are knocking on your door before it even debuts. For some, the privacy of an off-market sale offsets the considerable dollars left on the table. But for most of us, those dollars matter. And having multiple interested buyers instead of just one means better terms and more certainty as you head towards the closing table.

Still have questions? Contact one of our knowledgeable brokers for assistance with how to purchase, sell, or determine the value of any property you are considering.


Find a Home | Sell Your Home | Property Research | Neighborhoods | Market Reports | Our Team

We earn the trust and loyalty of our brokers and clients by doing real estate exceptionally well. The leader in our market, we deliver client-focused service in an authentic, collaborative and transparent manner and with the unmatched knowledge and expertise that comes from decades of experience.

© Copyright 2020 Windermere Mercer Island.

Waterfront December 11, 2020

Waterfront Defined

Terminology

These local definitions will not only to help you know the lingo when it comes to waterfront speak, but to give you quick access tools to research waterfront to your heart’s content. Here is a quick resource to commonly used terms related to waterfront real property:


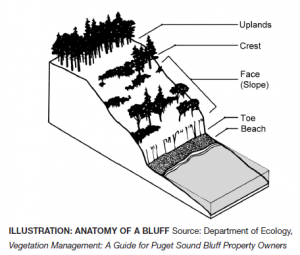
Bluff    Most beaches on Puget Sound are backed by bluffs. These bluffs can vary from spectacular, high eroding cliffs to low, vegetated banks. The erosion of bluffs is a significant source of sediment on many Puget Sound beaches. One way of classifying bluffs is by the amount of sediment they provide to local beaches as they erode. This is based on how fast they erode, how high they are, and how much sand and gravel they contain. In these maps, bluffs are assigned to the following categories: Exceptional Feeder Bluffs; Feeder Bluffs; Feeder Bluff – talus; and Transport Zones. This Department of Ecology Feeder Bluffs and Coastal Landforms Map is a great tool for identifying bluff categories.

Boathouse   A building designed for the storage of boats or watercraft to provide protection from the elements. The building of boathouses is generally prohibited under current environment regulations, but many grandfathered boathouses remain throughout the region.

Bulkhead   A solid or open pile wall of rock, concrete, steel or timber or other materials or a combination of these materials erected generally parallel to and near the ordinary high water mark for the purpose of protecting adjacent wetlands and uplands from waves or currents.

Dock   A raised walkway over water, often supported by widely spread pilings or pillars. Recent dock requirements encourage the use of decking structures and systems that encourage light and air flow to the water below. Also referred to as a pier.

Dock inspection   A structural and functional evaluation by an individual or company who specializes in dock construction and repair. This can involve an underwater dive evaluation when portions of the supporting structure is in question or unobservable from above.

High bank waterfront    Land that sits substantially above the natural water line, making the waterfront inaccessible without stairs or other structures, if at all.

Low bank waterfront   Land that sits just above the natural water line, often delineated with a bulkhead protecting the shoreline. Low and no bank waterfront abutting a navigable lake is often considered the most desirable waterfront in the Puget Sound region.

Medium bank waterfront   The most subjective of terms, this represents moderate bank land that is lower than high bank and higher than low bank waterfront.

Moorage    A place where a boat or ship are secured in the water. As it pertains to waterfront real estate, this is typically on a privately owned dock or boathouse.

Navigable water   “Navigability or navigable” means that a body of water is capable or susceptible of having been or being used for the transport of useful commerce. The state of Washington considers all bodies of water meandered by government surveyors as navigable unless otherwise declared by a court. See Who Owns the Water?

No bank waterfront   Land that graduates out to the natural water line without a bulkhead separating it from the shoreline. Often described as rolling waterfront, its spacious feel at lakeside is highly desirable.

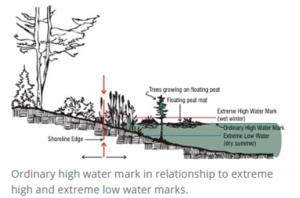
Ordinary High Water    “Ordinary high water” means, for the purpose of asserting state ownership, the line of permanent upland vegetation along the shores of nontidal navigable waters. In the absence of vegetation, it is the line of mean high water.

Pier   A raised walkway over water, often supported by widely spread pilings or pillars. Recent dock requirements encourage the use of decking structures and systems that encourage light and air flow to the water below. Also referred to as a dock.

Private Waterfront    Land abutting the water owned exclusively by an individual land parcel. Greater waterfront footage and amenities (beach/dock/moorage) create a more valuable parcel than one with limited waterfront footage or amenities.

Shared Waterfront    Land abutting the water owned in common (deeded) by owners of other often adjoining, land parcels. Fewer owner shares and deeded amenities (dock access/moorage) create a more valuable shared waterfront parcel than one with many owners or fewer amenities.

Shorelands    Land which is alternately covered and left dry by the rising and falling of the water level of a lake, river, or tidal area.

“First class shorelands” means the shores of a navigable lake or river belonging to the state not subject to tidal flow, lying between the line of ordinary high water and the line of navigability, or the inner harbor line where established and within or in front of the corporate limits of any city, or within two miles thereof upon either side (RCW 79.105.060(3)). These boundary descriptions represent the general rule; however exceptions do exist. To determine if the shorelands are within two miles of the corporate limits of a city, the distance is measured along the shoreline from the intersection of the corporate limit with the shoreline.

“Second class shorelands” means the shores of a navigable lake or river belonging to the state, not subject to tidal flow, lying between the line of ordinary high water and the line of navigability, and more than two miles from the corporate limits of any city (RCW 79.105.060(17)). These boundary definitions represent the general rule; however, exceptions do exist. To determine if shorelands are more than two miles from the corporate limits of a city, the distance is measured along the shoreline from the intersection of the corporate limit with the shoreline.

(Public) Tidelands   Land belonging to and held in public trust by the state for the citizens of the state, which are not devoted to or reserved for a particular use by law. Typically, the portion of land below the ordinary high water mark and the navigable water. Tide lines have been an area of great controversy in Washington State. Considered public domain through the Public Trust Doctrine. The Public Trust Doctrine does not allow the public to trespass over privately-owned uplands to access the tidelands. It does, however, protect public use of navigable water bodies below the ordinary high water mark.

“First class tidelands” means the shores of navigable tidal waters belonging to the state lying within or in front of the corporate limits of any city, or within one mile thereof upon either side and between the line of ordinary high tide and the inner harbor line; and within two miles of the corporate limits on either side and between the line of ordinary high tide and the line of extreme low tide (RCW 79.105.060(4)). In general, the line of ordinary high tide is the landward boundary. The line of extreme low tide, or the inner harbor line where established, is the waterward boundary. To determine if the tidelands are within two miles of the corporate limits of a city, the distance is measured along the shoreline from the intersection of the corporate limit with the shoreline.

“Second class tidelands” means the shores of navigable tidal waters belonging to the state, lying outside of and more than two miles from the corporate limits of any city and between the line of ordinary high tide and the line of extreme low tide (RCW 79.105.060(18)). In general, the line of ordinary high tide is the landward boundary. The line of extreme low tide is the waterward boundary. To determine if the tidelands are more than two miles from the corporate limits of a city, the distance is measured along the shoreline from the intersection of the corporate limit with the shoreline. Excerpt from the Department of Ecology Public Trust Doctrine.

Waterfront Footage   The linear feet that span the water’s edge of a land parcel.

Watershed   A watershed is the land area draining to a nearby river or lake, or sound.

Maps

There are many local map portals to assist in identifying topography, water conditions, hazards, and critical areas.

King County iMap

iMap Parcel Lookup Instructions (PDF)

Washington DNR Natural Hazards Geological Maps

Washington Geographic Information Portal Map

Department of Ecology Feeder Bluffs and Coastal Landforms Map

Department of Ecology Wetlands Inventory Map

NOAA Puget Sound Water Depth Chart


Resources

King County   

King County currently has about 1200 documented residential docks and 58 private boat ramps (see shoreline land use facts). A permit is required to build, modify, alter the land abutting a shoreline.

King County Shoreline Management Fact Sheets and Links

King County Shoreline Permit Submittal Requirements (PDF)

King County Bulkhead Shoreline Requirements (PDF)  

Shoreline Site Plan Requirements (PDF)

King County Shoreline Property Owner Resources

King County Lake Services and Information

Puget Sound Shoreline Stewardship Guidebook

King County Water and Shorelines Glossary


Washington State

Washington State (RCW) Aquatic Land legal definitions

DFW – Your Marine Waterfront (PDF)

DNR – Puget Sound and Coastal Geology

DNR – Puget Lowland Geological Province

Dept of Ecology – Mapping Bluffs and Beaches of Puget Sound (PDF)

WSU Guide for Shoreline Living (PDF)

UW Puget Sound Fact Book (PDF)


Environmental Protection Agency

EPA – Puget Sound

Shoreline and Wetland Tools and Resources

King County watershed overview map

Cedar River – Lake Washington Watershed (Lake Washington waterfront properties)

Central Puget Sound Watershed (North/West Seattle waterfront on Puget Sound)

Green-Duwamish River Watershed (South Seattle waterfront properties on Puget Sound)

Sammamish Watershed (Lake Sammamish waterfront properties)


National Oceanic and Atmospheric Administration

NOAA Portal

ERMA visualization map of Puget Sound

Bluffs, landforms and habitat classifications


The Watershed Company (site evaluation contractor) Articles

A home buyer’s guide to property with critical areas

Shoreline planning and permitting

Enhance your shoreline


We hope this provides an outstanding starting point in your waterfront journey. In addition to this specific research, don’t forget to evaluate all the typical aspects of your potential new home and neighborhood. We’ve compiled links to research tools from schools and geological hazards to market reports and census data.

While you’re there, you can also look up neighborhood info, including crime reporting, local government resources, parks and recreation, and school boundaries.

Of course, nothing tops having an experienced broker to guide you through the process. They’ve seen hundreds upon hundreds of homes and can help you identify the solid finds from the duds with gorgeous looking veneer.

Choosing the right broker can save you thousands on your home purchase. Whether through local market knowledge and pricing analysis allowing you to make a smarter offer, recommendations and resources to thoroughly conduct your due diligence and avoid costly mistakes, or savvy contract negotiation to help you get the terms you need, having a Windermere broker on your side is one advantage you can’t afford to sacrifice.


Find a Home | Sell Your Home | Property Research | Neighborhoods | Market Reports | Our Team

We earn the trust and loyalty of our brokers and clients by doing real estate exceptionally well. The leader in our market, we deliver client-focused service in an authentic, collaborative and transparent manner and with the unmatched knowledge and expertise that comes from decades of experience.

© Copyright 2020 Windermere Mercer Island.