Do you have extra space in your home or on your property? You may be able to put it to work as a rental and boost your ROI! With rising interest rates and inflation putting economic pressure on homeowners, rental apartments and tiny houses can be a great way to offset those higher costs. Some homeowners are even living in the ADU unit themselves while a renter in the main unit helps pay the mortgage for the property. For seniors, the cost offset from a rental unit can be enough to allow them to age in place in their own home.
Easing regulations from Washington State’s middle housing bill (HB 1337, in addition to HB 1110) have made it easier to add an ADU, DADU, or duplex in areas that previously didn’t allow it (read our full article on permitting and regulations for ADUs). Here is the rundown on how to turn your extra spaces into profit…
THE RIGHT SPACE…
Whether you’re converting your existing property or looking to invest in something new, there are many options for creating a rent-able space. Just make sure you’re following local requirements (size, parking capacity, set-backs, etc.) set by your local city or county. ADUs require a special permit—here is a guide to permitting requirements throughout Washington State. If you’re considering adding an ADU/DADU, check out this article on the benefits, risks, and things to consider.
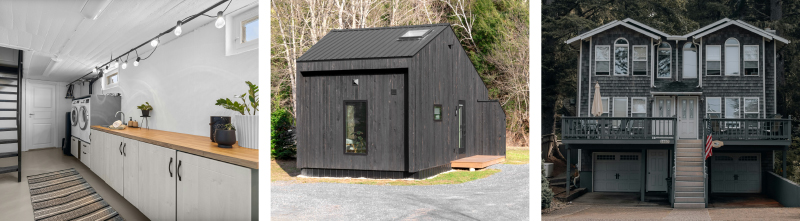
- ADUs (Accessory Dwelling Units), also known as in-law apartments, often take shape in converted basements, attics, or garages. They are self-contained living quarters within a larger single-family property that usually include their own kitchen/kitchenette, sleeping area, bathroom, and separate entrance.
- DADUs (Detached Accessory Dwelling Units) are ADUs that not physically connected to the main residence, sometimes referred to as tiny houses or granny cottages. They can either be constructed traditionally or installed as a prefab/modular unit. If you live in Seattle, consider using one of the 6 pre-approved ADU designs provided by the city; they speed up the permitting process from months to just weeks. You can even order pre-fab DADUs on Amazon.
- Small multi-family properties (like duplexes) have units that are typically larger, offer more privacy, and fetch higher rents than ADUs. However, they have special zoning requirements and may require special multi-family or investment financing. With the passage of Washington State House Bill 1110, they are permitted in many more areas than previously allowed.
THE RIGHT RENTAL TERM…
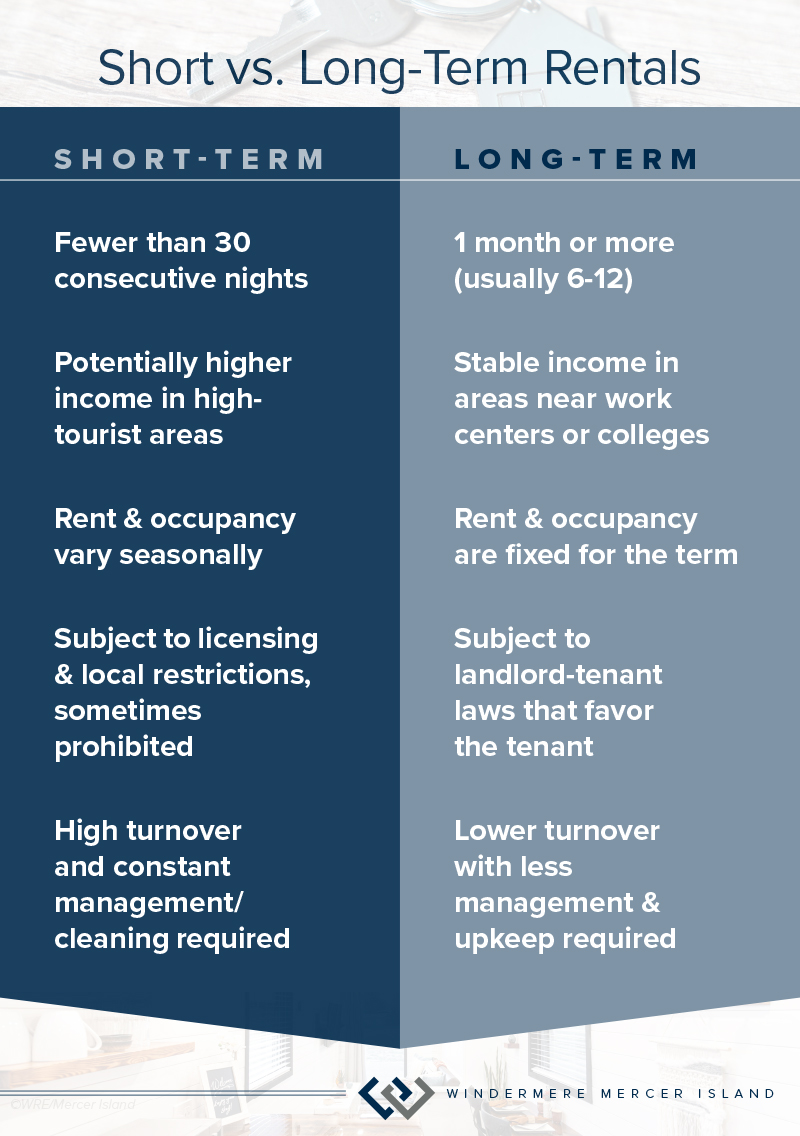
Once you determine the type of space you’d like to create, the next decision is whether you’ll be offering it as a long-term or short-term rental. Traditional long-term rentals with multi-month leases offer a stable income and are a great choice if your potential tenant would be working or attending school nearby. The low turnover rate also makes them relatively easy to manage apart from monthly rent collection and occasional repairs. The cons are that you have less flexibility to adjust the rent and are subject to often strict landlord-tenant laws that tend to strongly favor the tenant.
If you’re in a hot tourist area, offering your unit as a short-term rental on a platform like airbnb.com or vrbo.com can be a more lucrative option. Rental rates are typically much higher, however both rent and occupancy can vary seasonally. They also require constant management/cleaning due to their high turnover rate. Short-term rentals are subject to special licenses and restrictions, and are sometimes banned entirely by the city or your neighborhood Home Owner’s Association (HOA). Washington State also has special tax, insurance, and safety laws for short-term rentals.
No matter which type of rental you opt for, it is critical to do your homework and research requirements for licensing/permitting of rental properties in your community. From there you can delve deeper to estimate what your expenses and expected monthly rental income might be.
THE RIGHT PRICE…
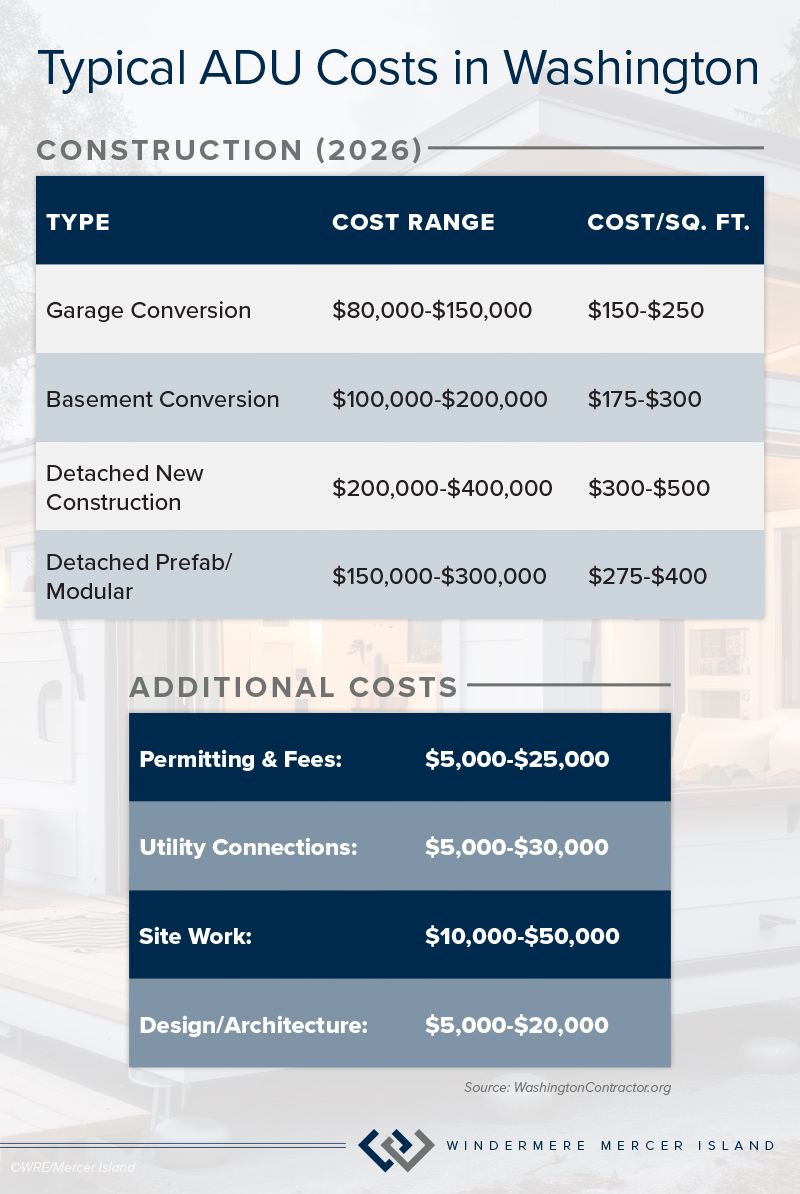
Before you invest money into converting, building, or or purchasing a property with a rental unit, it is critical to compare estimated costs with the average rent for that type of unit in your area. The 2% rule in real estate investing holds that your expected monthly rent should be at least 2% of the purchase/construction price for it to be a good value. For example, if ADUs rent for $2,000/mo in your area then you should spend less than $100,000 on establishing an ADU. Here are the average ADU costs as of March 2026 according to WashingtonContrators.org:
Did you know that HB 1337 also allows homeowners to sell an ADU separately from their main property? If you’re thinking about buying or selling a property with rental space, it’s a good idea to talk to your agent about the pros, cons, and pricing for your unique property. You can also check out these articles on how to design your rental to feel like a home, renovating short-term rentals, and tips to give your short-term rental a competitive advantage.


Find a Home | Sell Your Home | Property Research
Neighborhoods | Market Reports | Our Team
We earn the trust and loyalty of our brokers and clients by doing real estate exceptionally well. The leader in our market, we deliver client-focused service in an authentic, collaborative, and transparent manner and with the unmatched knowledge and expertise that comes from decades of experience.
2737 77th Ave SE, Mercer Island, WA 98040 | (206) 232-0446
mercerisland@windermere.com
© Copyright 2026, Windermere Real Estate/Mercer Island.


