Facebook
 X
X
 Pinterest
 Copy Link

Summer is seasonally slumpy in the Greater Seattle area. There are so many distractions! Looking back at our Summer Slump this year, however, we believe it could be a sign of things to come. With new listings up year over year, sales cooling, and more than 3 months worth of listing inventory (4+ months on the Eastside), we may be nearing the first true buyer’s market we’ve seen since September of 2011.
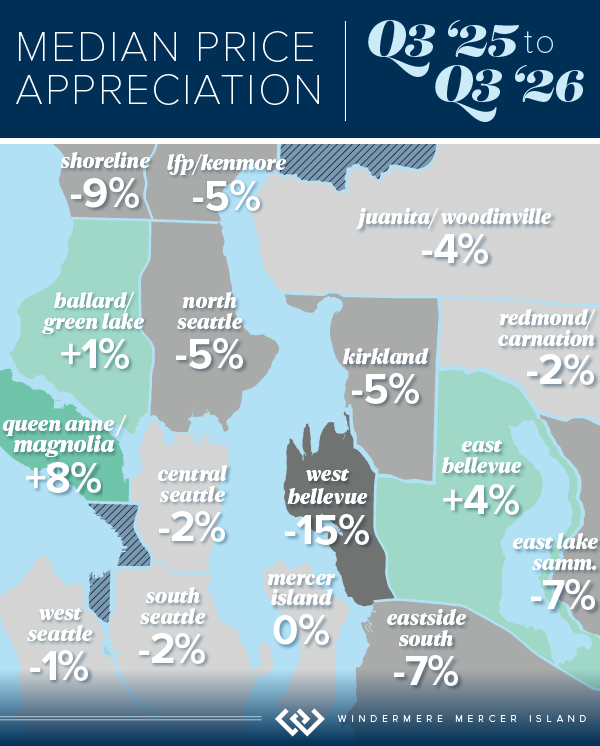
Prices dipped or remained flat in most areas, although a few neighborhoods saw a year-over-year boost. About half of Seattle homes and 1/3 of Eastside homes sold within their first 10 days on the market. While exceptionally desirable properties still drew bidding wars, the vast majority of homes sold at or below their listed prices.
The stats are sobering, but our situation is so much different now than in 2011. The main difference: homeowners have equity to tap into in most cases. Nationally, over 41% of homeowners have more than 50% equity in their homes. In 2011 we were plagued by short sales and foreclosures, which is simply not the case today. While interest rates have hit their highest levels since 2000, it is still a great time to move, especially if you’re considering a trade up. Remember, inventory hasn’t been this plentiful in 15 (fifteen!) years. If you’re feeling like you’ve outgrown your house or your house has outgrown you, a skilled agent can help you with an analysis to decide if it’s your time to take advantage of this buyer’s market.
Click or scroll down to find your area report:
Seattle | Eastside | Mercer Island | Condos | Waterfront
SEATTLE
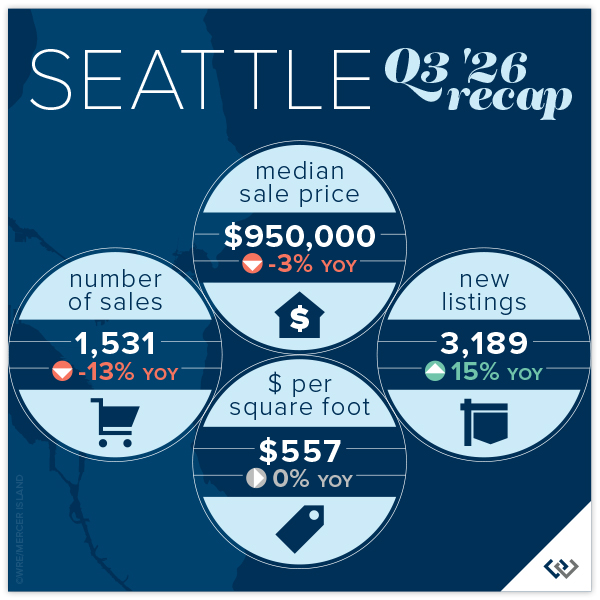
The core Seattle neighborhoods seem to still be attracting attention (and gains); Queen Anne/Magnolia saw a 9% dip in volume but an 8% gain in median price, from $1,299,000 to $1,399,000. Shoreline saw a 9% dip in price while sales volume stayed steady at -2%.
All in all, residential real estate in the city remained relatively flat, seeing a 3% drop from Q3 2025. It will be interesting to see what the quarters to come will hold. In true Seattle fashion, the booms aren’t as big and the dips are easier to fare.
Click here for the full report and neighborhood-by-neighborhood statistics!

EASTSIDE
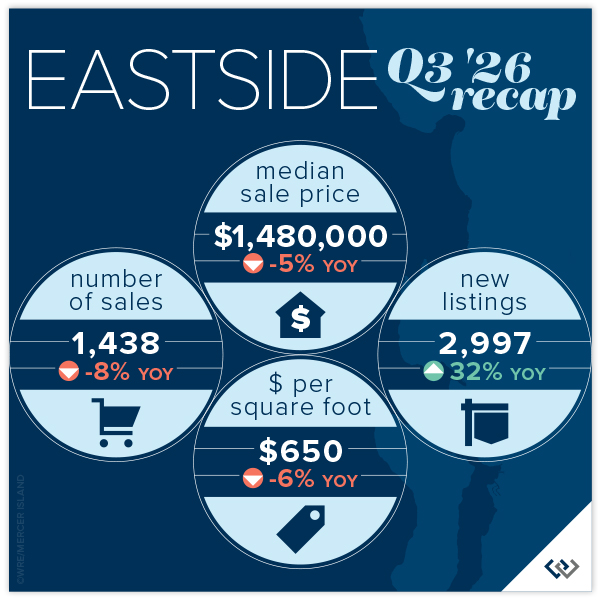
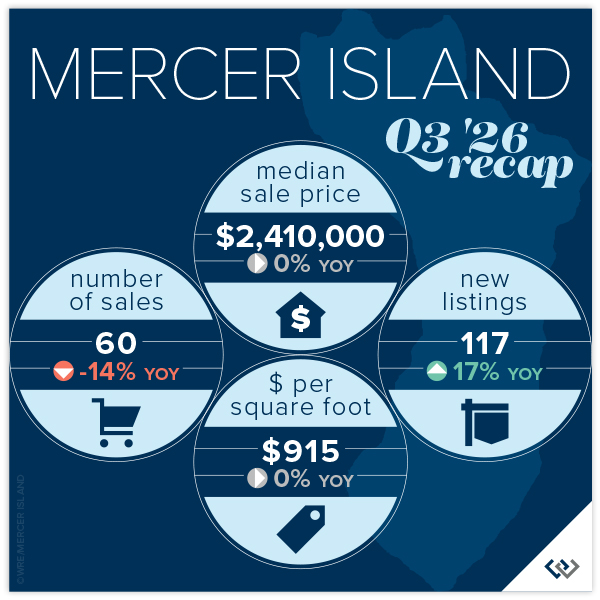
It is clear that the ultra-high end has had the largest correction; West Bellevue is down 15% year over year and 22% since the peak in Q4 2025. Mercer Island is flat year over year, but the disparity between median active price ($3.3m) and median sold price ($2.4m) tells us that there is a glut of high-end inventory.
The bright spot for sellers is East Bellevue, posting a 4% year-over-year gain at a median price of $1,610,000. With all of this, 36% of homes still sold above the list price, a sure sign that some home sellers are taking their savvy agents’ advice on positioning.
Click here for the full report and neighborhood-by-neighborhood statistics!

MERCER ISLAND
If you can “nail” price and presentation, you have a 55% chance of selling in the first 10 days on the market and being like the 43% of homes that sold for at or above list price during Q3. If you’re on First Hill, in Mercer Island Estates or the Lakes, odds are you’re in this group; 100% of those homes sold in the first 10 days. Location, Location, Location! Though, if you don’t get it right the first time (like 57% of the market) you could be facing a pool of buyers who expect a larger discount than we’ve seen in recent years.
New listings are up year over year on the Island by 17%, making this a good time to trade up if you’ve been considering an upgrade. There are 18 active waterfront properties and with only 3 sales in Q3 (typically waterfront season) that translates to 18 months of waterfront inventory. I can’t remember a better time to snag a piece of coastline!
Click here for the full report and neighborhood-by-neighborhood statistics!

CONDOS – SEATTLE & EASTSIDE
Year-over-year Seattle condo prices slipped 2.7%, which is the slimmest margin we’ve seen in a while. There is a large disparity across the region with Lake Forest Park seeing a 27% gain in median price compared to an 18% decline for Downtown condos. The velocity doesn’t seem to be affected with 22% of listings selling in the first 10 days and an average of 39% of all homes selling above asking price. Our home shoppers are savvy and willing to jump for something special.
On the Eastside there is slightly more volatility. Sales are down a total of 26%, meaning only 409 lucky home sellers were able to hand over their keys in Q3. When you consider that there were 1,109 new listings, that number is tough to swallow. Those home shoppers got great deals as the median price was down 12% year-over-year. Nowhere was this more true than on Mercer Island with a 23% dip in median price (though with only 14 of those 409 sales, that dip may just be a temporary product shift).
The stats are sobering, but somewhat encouraging, especially if you are thinking about stepping onto the first rung of the property ladder. Condos are an incredible value and prices have to be hitting the bottom. While some homeowners have equity, we’re often seeing prices go back to 2017 and 2018 levels. There are 25 condos in King County listed as short sales. The bargains are out there just waiting to be snapped up!
Check out area-by-area details in the full condo report.

WATERFRONT
Seattle and Lake Sammamish led the pack in Q3 with 12 waterfront home sales each. Both beat last year’s numbers, with Seattle up from 10 and Lake Sammamish up from 9 in Q3 2025. On the other hand, the Eastside slowed to 7 sales from 11 a year ago. Mercer Island also saw a slowdown with just 3 waterfront sales compared to 6 in Q3 of last year.
In spite of its lower volume of sales, Mercer Island can still boast the highest price: $28 million for a custom estate clocking in at nearly 10,000 sq. ft. with over an acre of grounds and 109 feet of prime low-bank waterfront. At the opposite end, a 1929 fixer on the south end of Lake Sammamish sold off-market at a steal (and below its assessed value) for just $1,000,000.
This brief overview of the entire Seattle-Eastside private waterfront market, including Mercer Island and Lake Sammamish, illustrates the trends occurring in our region over time. This data is interesting and insightful but cannot replace an in-depth waterfront analysis with your trusted professional.
View the full waterfront report


Find a Home | Sell Your Home | Property Research
Neighborhoods | Market Reports | Our Team
We earn the trust and loyalty of our brokers and clients by doing real estate exceptionally well. The leader in our market, we deliver client-focused service in an authentic, collaborative, and transparent manner and with the unmatched knowledge and expertise that comes from decades of experience.
2737 77th Ave SE, Mercer Island, WA 98040 | (206) 232-0446
mercerisland@windermere.com
© Copyright 2026, Windermere Real Estate/Mercer Island. Information and statistics derived from Northwest Multiple Listing Service and Trendgraphix, and deemed accurate but not guaranteed.
Seattle report cover photo courtesy of Anni Zilz; and Andrew Webb, Clarity NW Photography.
Eastside report cover photo courtesy of Mike Ferreri; and Kell Morrissey, Clarity NW Photography.
Mercer Island report cover photo courtesy of Laurie Givan; and Matthew Gallant, Clarity NW Photography.
Condo report cover photo courtesy of Luke Bartlett; and Matthew Gallant, Clarity NW Photography.